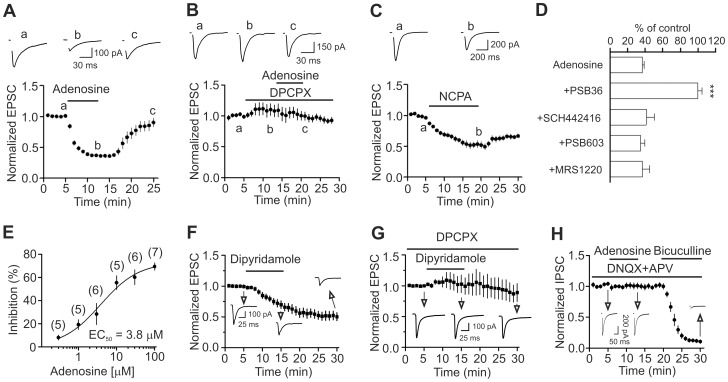
Figure 2. Adenosine decreases the amplitude of evoked AMPA EPSCs via activation of A1 ARs without altering that of the evoked IPSCs recorded from layer III pyramidal neurons in the medial EC.
A, Bath application of adenosine (100 µM) reversibly inhibited the evoked AMPA EPSCs (n = 15, p<0.001 vs. baseline, paired t-test). Upper panel shows the average of 10 EPSCs recorded at different time points in the figure. Stimulation artifacts were blanked for clarity (same for the rest of the figures). B, Bath application of the A1 AR antagonist, DPCPX (1 µM) completely blocked adenosine-induced depression of AMPA EPSCs (n = 5, p = 0.8 vs. baseline, paired t-test). C, Bath application of the A1 AR agonist, NCPA (2 µM), inhibited AMPA EPSCs (n = 10, p<0.001 vs. baseline, paired t-test). D, Application of the antagonists for receptors other than A1 ARs failed to block adenosine-induced depression of AMPA EPSCs (One-way ANOVA followed by Dunnett test, *** p<0.001 vs. adenosine alone). E, Concentration-response curve of adenosine. The numbers in the parentheses are the numbers of cells used for each concentration. F, Bath application of dipyridamole (1 µM), an adenosine transporter inhibitor, significantly reduced the evoked EPSCs (n = 10, p<0.001, paired t-test) suggesting that endogenously released adenosine decreases AMPA EPSCs. G, Prior application of DPCPX, an A1 AR blocker, blocked dipyridamole-induced depression of AMPA EPSCs (n = 5, p = 0.85 vs. baseline, paired t-test) suggesting that the inhibitory effect of dipyridamole is mediated via activation of A1 ARs. H, Bath application of adenosine (100 µM) had no effects on the evoked IPSCs recorded at −70 mV from layer III pyramidal neurons (n = 7, p = 0.84 vs. baseline, paired t-test). The extracellular solution contained DNQX (20 µM) and dl-APV (100 µM). At the end of the experiments, application of bicuculline (20 µM) completely blocked IPSCs indicating that the recorded IPSCs were mediated by activation of GABAA receptors.

