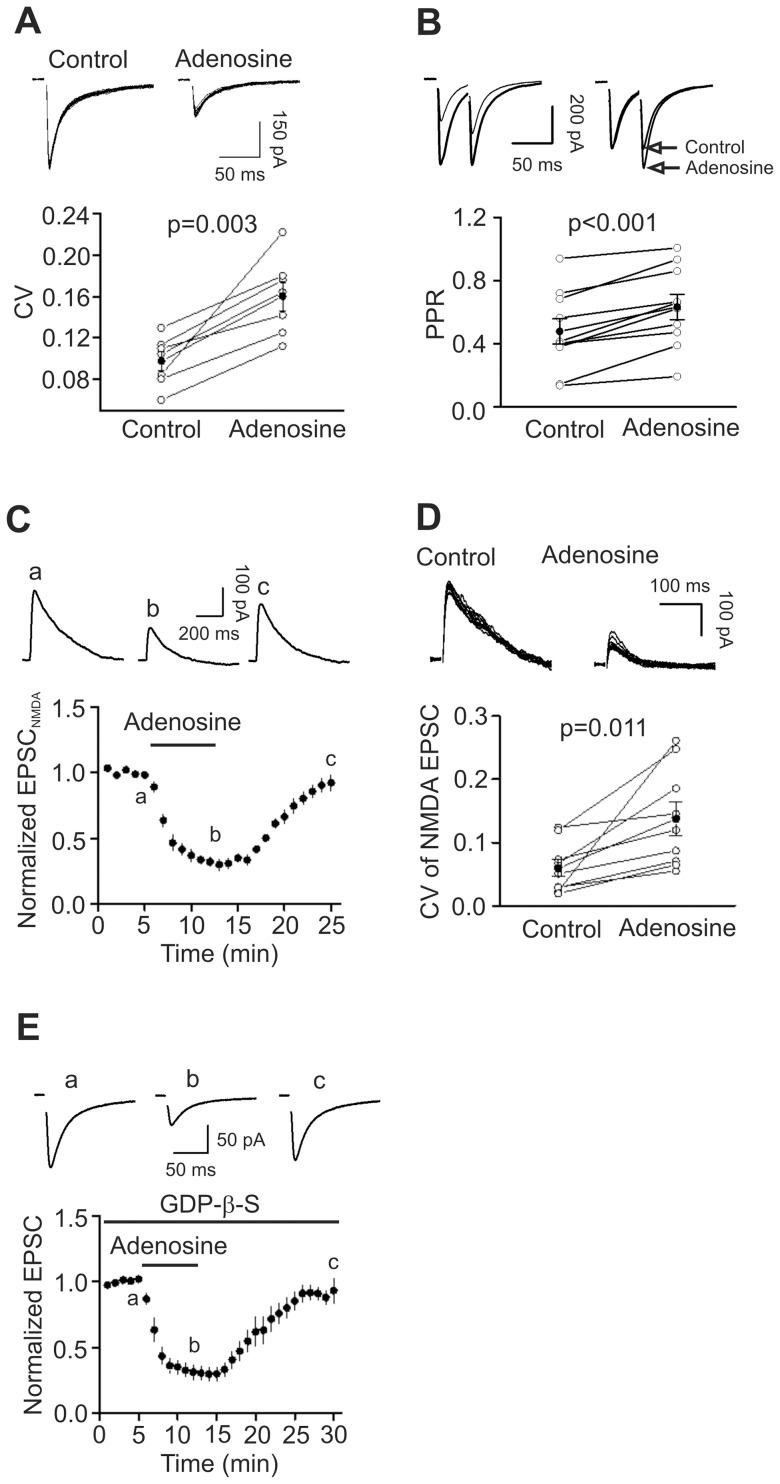
Figure 3. Adenosine inhibits AMPA EPSCs by decreasing presynaptic glutamate release.
A, Application of adenosine increased the CV of AMPA EPSCs (n = 7, p = 0.003, paired t-test). Upper panel shows 15 consecutive AMPA EPSCs recorded before and during the application of adenosine. Lower panel shows the calculated CVs from 7 cells (open circles) and their averages (solid circles). B, Adenosine increased PPR (n = 10, p<0.001, paired t-test). Upper left, AMPA EPSCs evoked by two stimulations at an interval of 50 ms before and during the application of adenosine. Upper right, EPSCs recorded before and during the application of adenosine were scaled to the first EPSC. Note that the second EPSC after the application of adenosine is larger than control. Bottom, PPRs recorded from 7 cells (open circles) and their averages (solid circles). C, Application of adenosine inhibited NMDA EPSCs (n = 9, p<0.001 vs. baseline, paired t-test). Upper panel shows the averaged NMDA EPSC of 5 EPSCs at different time points in the figure. D, Application of adenosine increased the CV of the NMDA EPSCs (n = 9, p = 0.011, paired t-test). Upper panel shows 10 successive NMDA EPSCs recorded before (left) and during (right) the application of adenosine. Lower panel shows the calculated CVs from 9 cells (open circles) and their averages (solid circles). E, Intracellular application of GDP-β-S via the recording pipettes did not significantly alter adenosine-induced depression of AMPA EPSCs (n = 6, p<0.001 vs. baseline, paired t-test).

