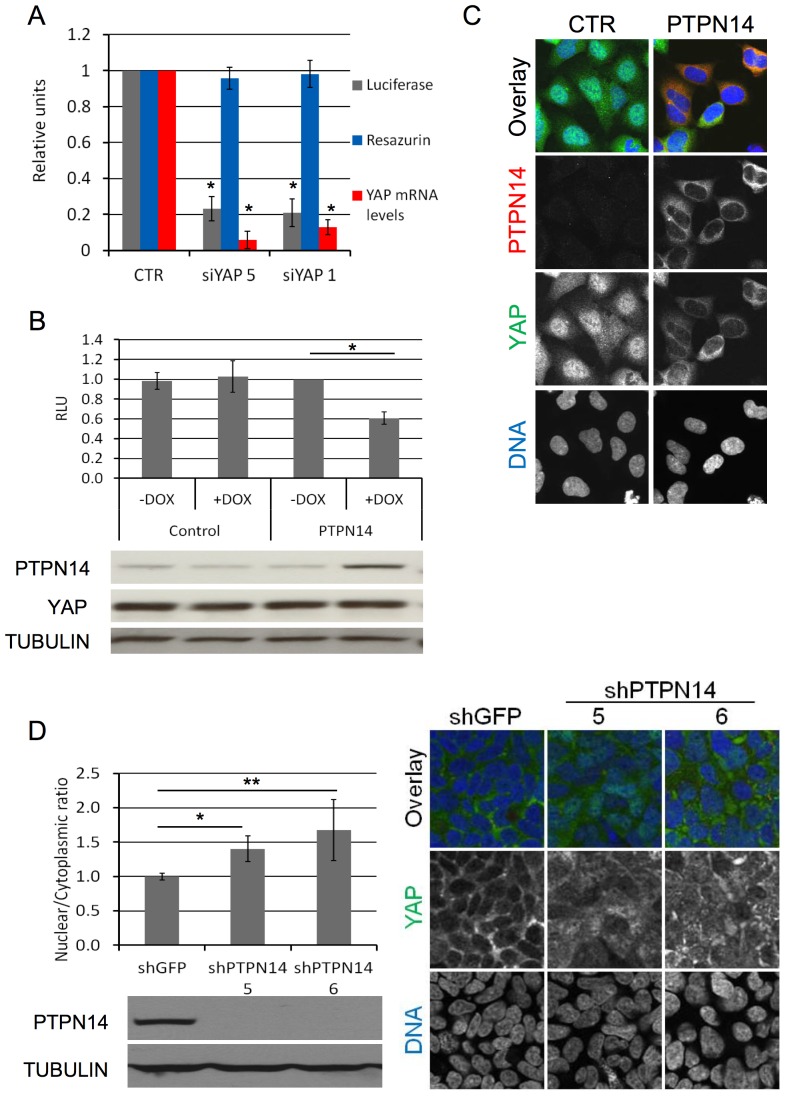
Figure 2. PTPN14 is a negative regulator of YAP.
A) An SF268 cell line stably expressing the YAP-responsive MCAT_Luc reporter was transfected with two independent siRNAs against YAP and analysed in a Resazurin and luciferase assay 72 h after transfection. mRNA levels of YAP were determined by QRTPCR. Luciferase results are normalized based on the Resazurin results. All results are the average of 5 experiments ± STDEV. Statistical analysis was carried out with a 2-tailed paired t-test for each siRNA; * p<0.0001. B) An SF268 cell line stably expressing the YAP-responsive MCAT_Luc reporter was transduced with lentivirus encoding for dox-inducible PTPN14 expression. After pharmacological selection, luciferase expression was measured for both cell lines in the presence and absence of dox (upper panel). A Resazurin assay was carried out in parallel for each sample and used to normalize the luciferase readings. Results are shown as the average of three independent experiments ± STDEV. Statistical analysis was carried out with a 2-tailed paired t-test; * p<0.0001. RLU: relative luciferase units. PTPN14 expression achieved by dox and YAP levels in each sample was analyzed by Western blot (lower panel). Tubulin serves as loading control C) 293A cells were transduced with lentivirus encoding dox-inducible PTPN14 expression. YAP localization in control and PTPN14-expressing cell lines was analysed 72 hours post dox induction by IF at low density using confocal miroscopy. D) 293A cells were transduced with lentivirus encoding two independent dox-inducible shRNAs targeting PTPN14. The nuclear/cytoplasmic ratio of YAP was quantified at high density 72 hours post dox induction using a Cellomics automated imager with a conventional microscope, and expressed relative to the control shGFP (left upper panel). Results are shown as the average of 3 independent experiments ± STDEV. For each experiment, the average ratio was calculated from three wells per sample (10 images per well). Statistical analysis was carried out with a 2-tailed paired t-test; * p<0.001, ** p<0.05. Western blot analysis of PTPN14 levels, indicating the efficiency of each shRNA (left lower panel). Tubulin serves as a loading control. Confocal microscopy images of cells 72 hours post dox induction (right panel).

