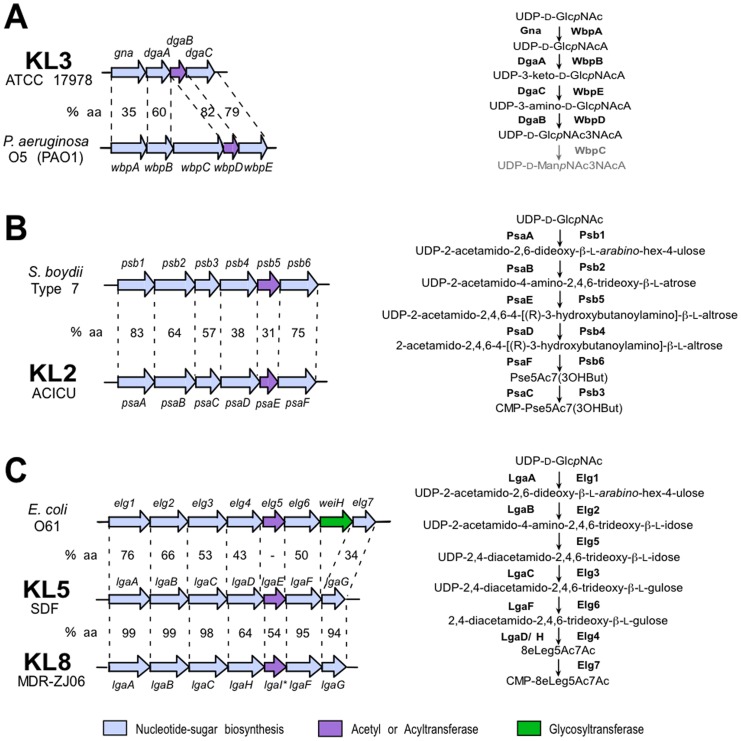
Figure 5. Comparison of nucleotide-linked sugar regions to related gene modules and sugar pathways. A.
KL3 region 2 compared to a region from O5 from P. aeruginosa PAO1 [GenBank accession U50396]. The biosynthesis pathway for UDP-GlcpNAc3NAcA determined by [37] is shown on the right. B. KL2 region 3 compared to a region from the S. boydii Type 7 O-antigen locus [GenBank accession EU296411]. The biosynthesis pathway for CMP-Pse5Ac7(3OHBut) predicted by [39] is on the right. C. KL5 region 4 compared to KL8 region 4 and a region from the E. coli O61 O-antigen cluster [GenBank accession GU220362]. The predicted biosynthesis pathway for CMP-8eLeg5Ac7Ac [64] is shown on the right. Horizontal arrows represent genes showing the direction of transcription, with gene names shown above. Genes are coloured by the predicted function of their gene product and the colour scheme is shown the below. * indicates frameshifts. The% identity between predicted gene products is shown between aligned pairs of gene clusters. Regions are defined in Figure 3. The figure is drawn to scale from the GenBank entries listed in Table 1 and above.

