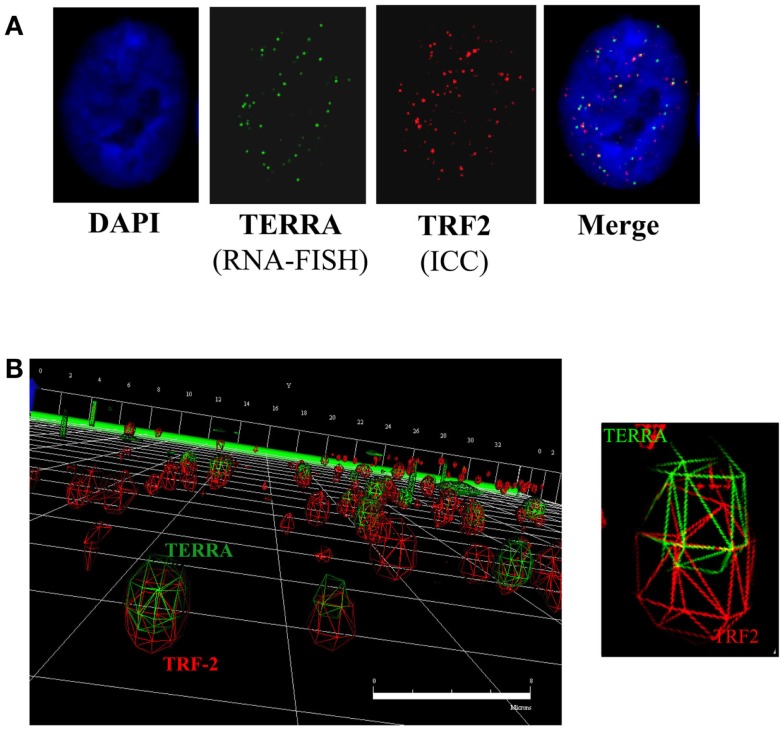
Figure 3.
TERRA co-localization at telomeres. (A) 2D analysis of TERRA and TRF2 foci. Merging of the green (TERRA) and red (TRF2/telomeres) channels denotes potentially co-localized foci as yellow signals. (B) 3D analysis of TERRA and TRF2 foci. Deconvolution and 3D reconstruction of 22 stacks per cell nuclei provided a high-resolution perspective of TERRA co-localization at individual telomeres. Navigation of the 3D image provided a defined representation of telomere location throughout the cell nucleus, as well as TERRA distribution; i.e., either bound (co-localized with telomere) or free (not co-localized with telomere). Scale bar = 8 microns.

