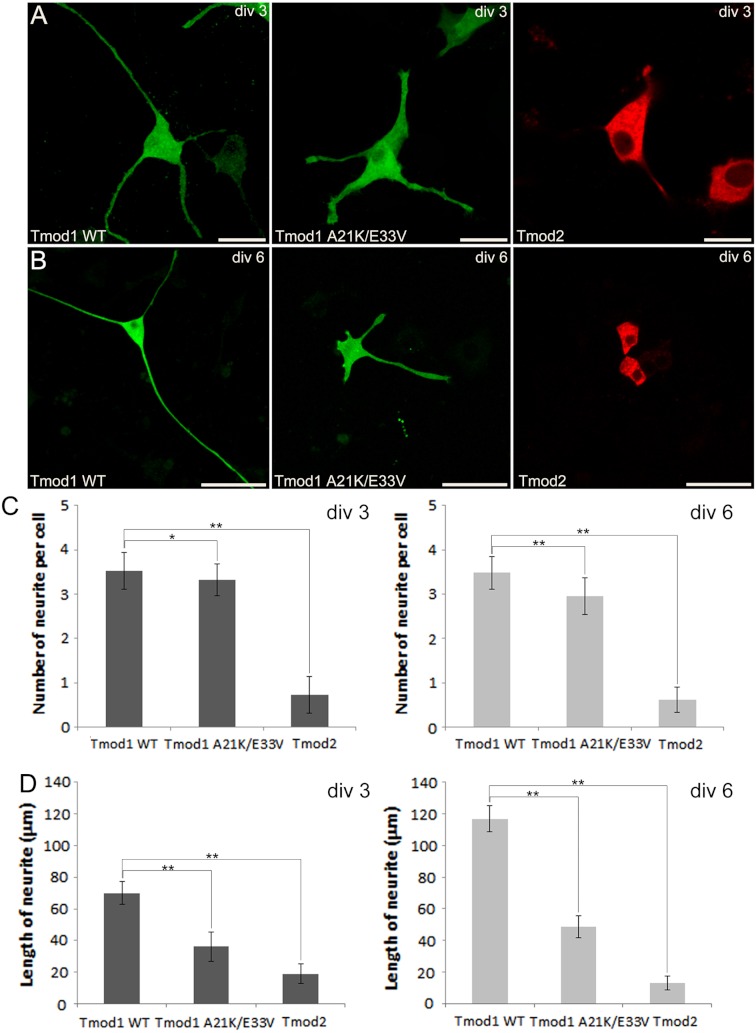
Figure 1. Confocal imaging illustrating the effect of Tmod expression on PC12 neuronal differentiation.
(A) PC12 cells over-expressing GFP-Tmod1 wild-type, GFP-Tmod1 mutant, and mChFP-Tmod2 after three days of NGF-induced neuronal differentiation. Bar = 20 µm. (B) PC12 cells over-expressing GFP-Tmod1 wild-type, GFP-Tmod1 mutant and mChFP-Tmod2 after six days of NGF-induced neuronal differentiation. Bar = 50 µm. (C) Bar graphs showing the number of neurites per cell and (D) the average length of neurites in PC12 cells over-expressing GFP-Tmod1 WT (n = 55), GFP-Tmod1 A21K/E33V (n = 48) and mChFP-Tmod2 (n = 45) three days (dark grey bars) and six days (light grey bars) after NGF-induced neuronal differentiation. Error bars in C) and D) represent sd (*: p < 0.01 and **: p < 0.0005; One-way ANOVA).

