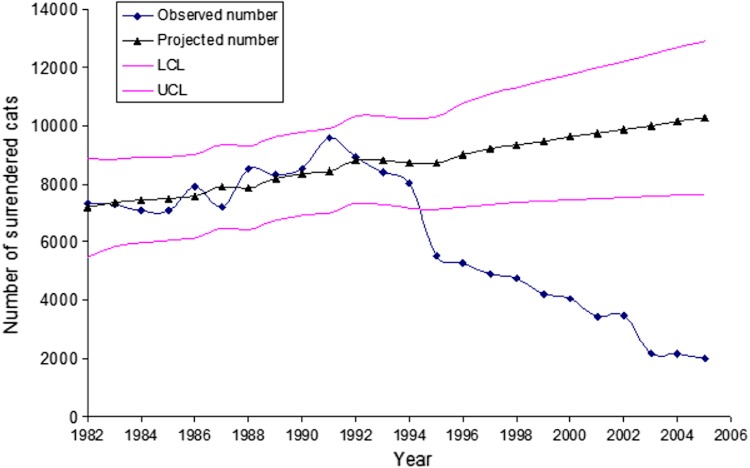
Figure 5. Observed numbers of cats surrendered to the shelters in Santa Clara County versus autoregressive integrated moving average (ARIMA) projected numbers of surrendered cats.
Figure uses the 1982–1993 data (before the launch of the spay/neuter voucher program) shelter data. The lower (LCL) and upper (UCL) 95% confidence limits of the ARIMA projection are also presented.

