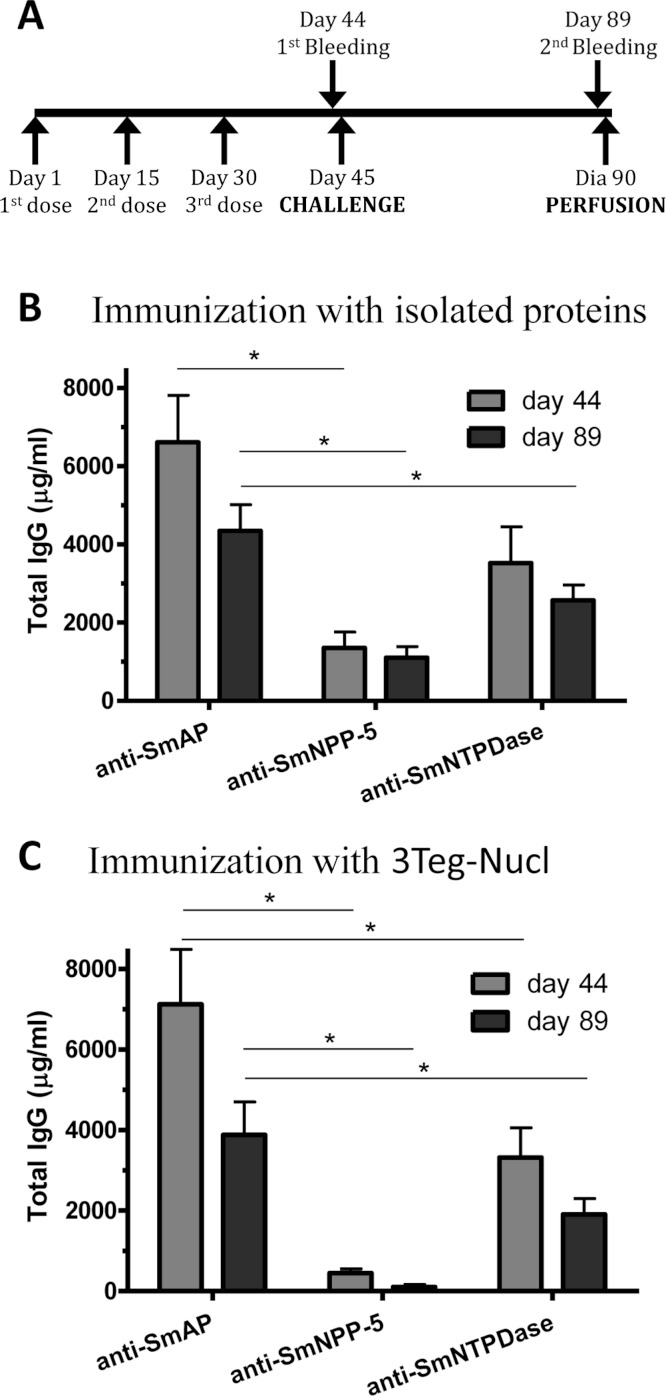
Figure 1. Standard immunization schedule and total IgG levels induced by immunization with tegument nucleotidases.
(A) Immunization, bleeding, challenge and mouse perfusion schedule. (B) Specific total IgG induced by immunization with isolated nucleotidases before and after challenge. (C) Specific total IgG induced by immunization with combined nucleotidases (3Teg-Nucl) before and after challenge. The bars are Mean ± SEM; ∗ = ρ ≤ 0.05.

