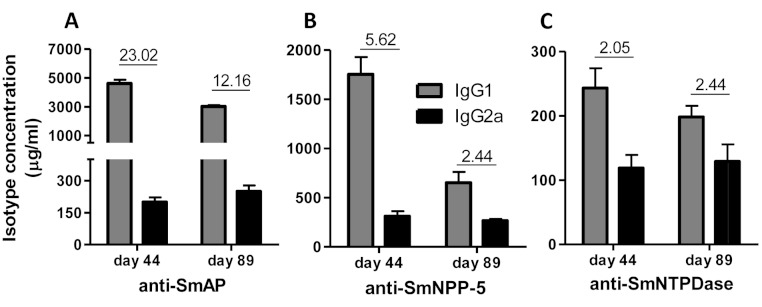
Figure 2. IgG1 and IgG2a levels induced by immunization with isolated tegument nucleotidases.
(A) Specific IgG1 and IgG2a levels induced by immunization with SmAP before and after challenge. (B) Specific IgG1 and IgG2a levels induced by immunization with SmNPP-5 before and after challenge. (C) Specific IgG1 and IgG2a levels induced by immunization with SmNTPDse before and after challenge. The bars are Mean ± SEM. The numbers over the bars are the IgG1/IgG2a ratios.

