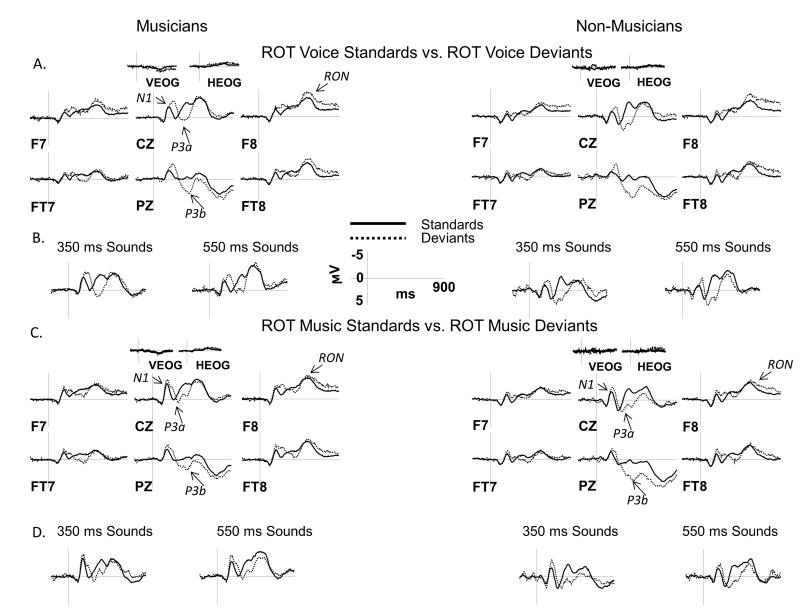
Figure 4.
ERP results in the ROT condition: standards vs. deviants
ERPs elicited by vocal and musical sounds in the ROT condition are shown over a representative set of electrodes. A, C: ERPs elicited by deviants are overlaid with those elicited by standards separately for musicians (left side) and non-musicians (right side) and for vocal (panel A) and musical (panel C) sounds. ERPs were averaged across short and long sound durations for all comparisons. B, D: Separate ERP grand averages for short (350 ms) and long (550 ms) sounds are shown at the CZ site for vocal (panel B) and musical (panel D) sounds. Analyzed ERP components are marked on multiple electrode sites. Negative potentials are plotted upward. Time 0 ms indicates the onset of the stimulus.

