
Figure 5).
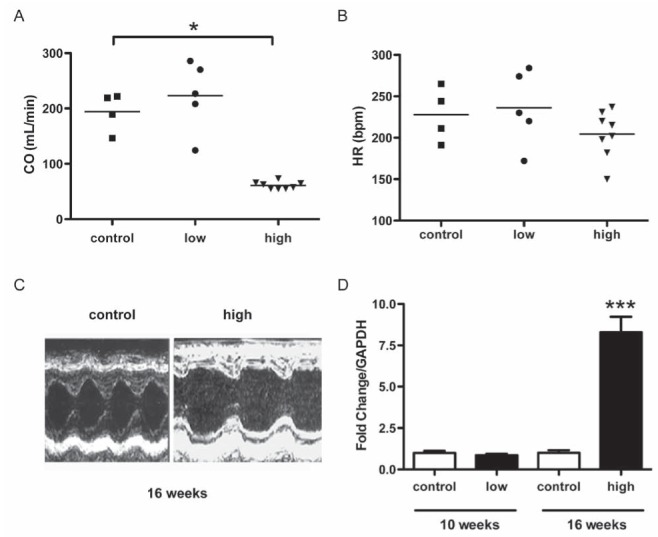
Functional analysis by echocardiography provides additional evidence for left ventricle dysfunction. Data are expressed as mean ± SEM. A The high-dose group exhibited a striking reduction in cardiac output at 16 weeks (60.95±6.7 mL/min) compared with the control group (194.17±35.09 mL/min). B There was no significant difference in heart rate between the three groups at 16 weeks (control 227±33 bpm, low-dose 236±45 bpm, high-dose 204±28 bpm) from baseline (data not shown). These results indicate that a reduction in stroke volume accounts for the decrease in high-dose cardiac output. C Representative M mode echocardiograms (transverse view) of the left ventricle of a rat from the control group (left) and from the high-dose group (right). The diastolic diameters are similar. D The left ventricle dysfunction was confirmed by a significant transcriptional increase in atrial natriuretic peptide in the high-dose group compared with the control group, determined by real-time PCR. *P<0.05; ***P<0.001