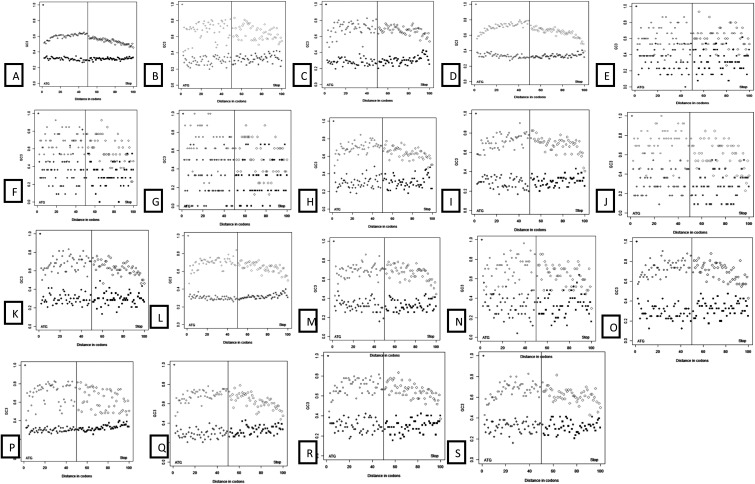
Figure 4.
GC3 gradient across Citrus species and P. trifoliata. Species order: A = C. sinensis; B = C. aurantifolia; C = C. aurantium; D = C. clementina; E = C. clementina × C. tangerina; F = C. jambhiri; G = C. japonica var. margarita; H = C. limettioides; I = C. limonia; J = C. medica; K = C. reshni; L = C. reticulata; M = C. reticulata × C. temple; N = C. sinensis × P. trifoliata; O = C. sunki; P = P. trifoliata; Q = C. unshiu; R = C. paradisi; and S = C. paradisi × P. trifoliata. These plots show gradients of GC3 for 5% of GC3-rich and GC3-poor genes for all analysed genomes. Gradients from 5′ and 3′ ends of the CDS are shown in the same plot, separated by a vertical line. For all genomes, GC3-rich genes become more GC3 rich towards the middle of the CDS.

