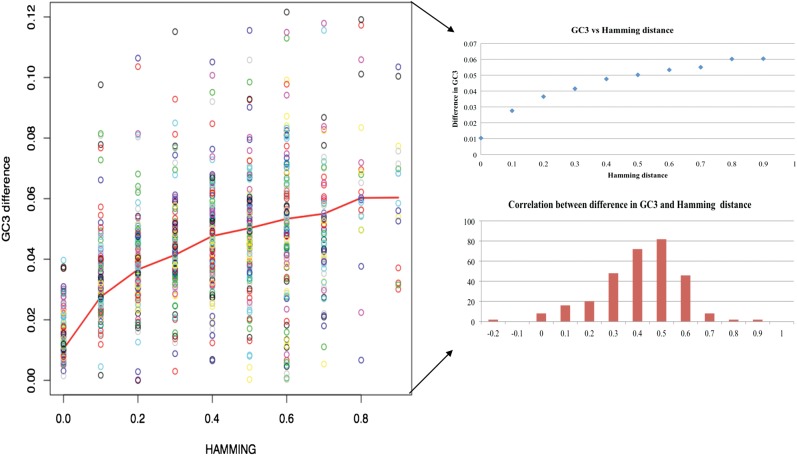
Figure 6.
Hamming distance versus change in GC3 visualization across Citrus species and P. trifoliata. Relative difference GC3 composition between genes A and B, defined as GC3 (A)-GC3 (B)/[GC3 (A) + GC3 (B)] is positively correlated with the Hamming distance between corresponding protein sequences, calculated as 1–[I (AB) + I (BA)]/[I (AA) + I (BB)], where I (AB) is the number of identities in alignment of protein A to protein B. The resulting Hamming distance was rounded to 1 DP, and an average difference in GC3 was computed for each category.

