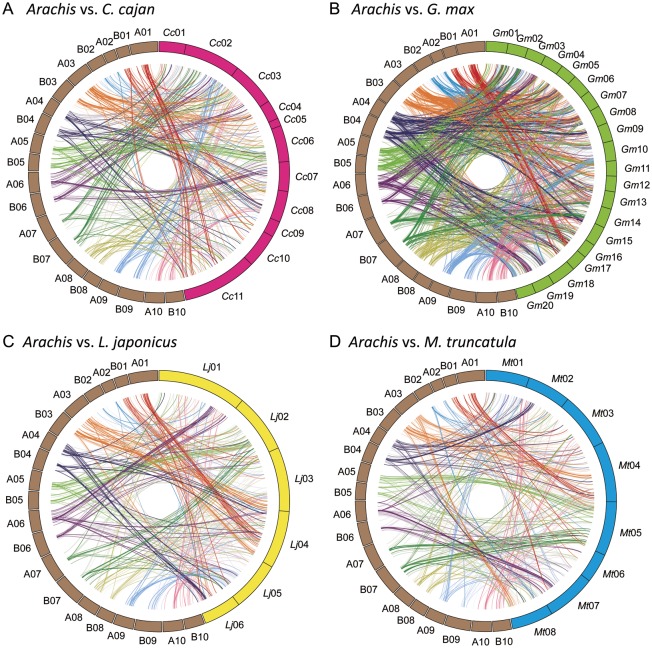
Figure 3.
Comparative maps of Arachis and four other legumes, C. cajan, G. max, L. japonicus, and M. truncatula. Circled bars in brown, magenta, green, yellow, and blue indicate the genomes of Arachis, C. cajan (A), G. max (B), L. japonicus (C), and M. truncatula (D), respectively. Homologous loci are connected by lines.

