Figure 6.
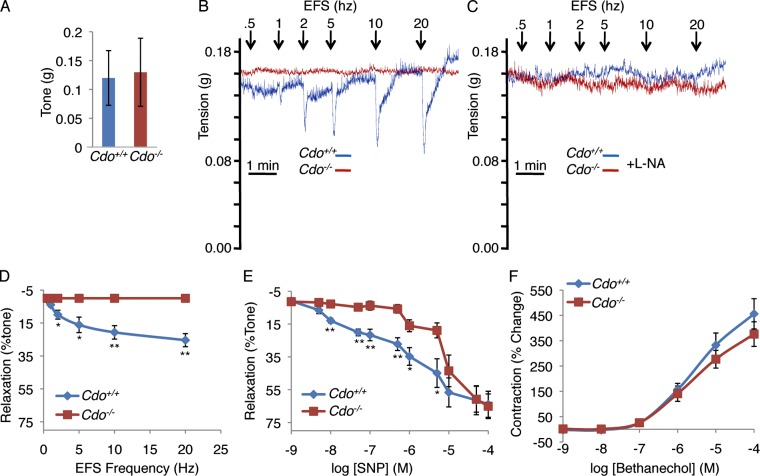
The Cdo−/− LES fails to relax in response to EFS or SNP. (A) The LES from Cdo+/+ and Cdo−/− mice have similar amplitudes of basal tone. (B) Tension recordings of LES smooth muscle strips. Data shown are from single representative experiments out of five independent experiments on five different LES preparations. Panel D shows results quantified from these experiments. Note that the Cdo+/+ LES displays transient, frequency-dependent relaxation, which is absent in the Cdo−/− LES. (C) Similar to B, except 1 µM L-NA was included. Data shown are from single representative experiments out of five independent experiments on five different LES preparations. (D) Quantification of EFS frequency-dependent relaxation of LES smooth muscle strips from Cdo+/+ and Cdo−/− mice. (E) Quantification of the relaxation response of LES strips from Cdo+/+ and Cdo−/− mice to different concentrations of SNP. (F) Quantification of the contraction response of LES strips from Cdo+/+ and Cdo−/− mice to different concentrations of bethanechol. Values in D–F are means ± SD, n = 5. *, P < 0.05; **, P < 0.005.

