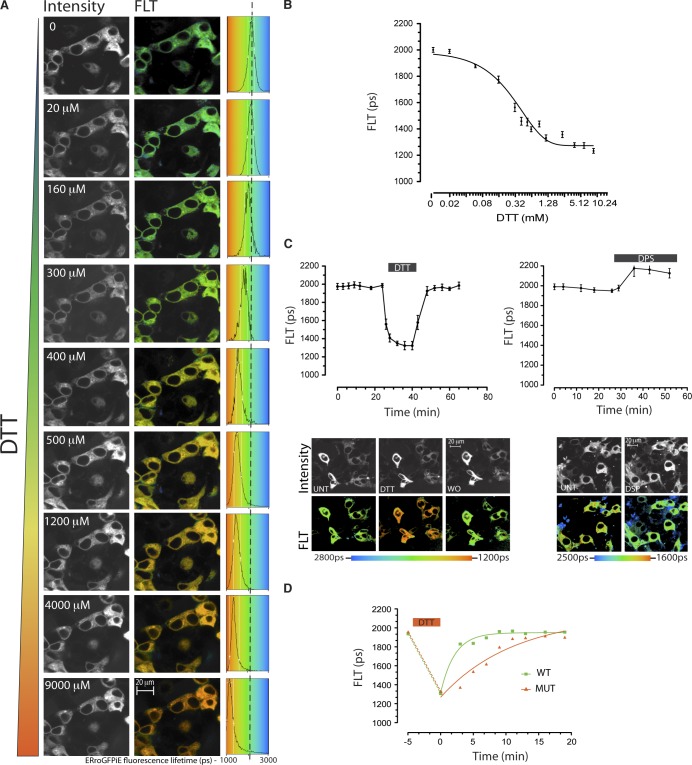
Figure 4.
Faithful tracking of dynamic changes in ER redox by ERroGFPiE. (A) Fluorescent intensity–based (in grayscale) and lifetime images (color-coded to the scale of the histogram on the right) of HEK 293T cells expressing ERroGFPiE exposed sequentially at 10-min intervals to escalating concentrations of the reducing agent DTT (concentration noted in the inset). A histogram of the distribution of lifetimes in the population of cells is provided (right), noting the mean ± SD lifetime. (B) Plot of the relationship between DTT concentration and probe lifetime derived from the experiment described in A. (C) A trace of time-dependent changes in ERroGFPiE fluorescence lifetime (FLT in picoseconds) in live HEK 293T cells, before, during, and after brief exposure to 2 mM DTT or 1 mM of the oxidizing agent DPS. Fluorescent emission intensity (in black and white) and lifetime (color-coded) images of cells before (UNT), during the DTT pulse, and after its washout (WO) are shown in the bottom panel. (D) As in C, comparison of lifetime changes after a reductive pulse of DTT applied to wild-type (WT) and compound Ero1l-, Ero1lB-, and Prdx4-deficient mutant (MUT) mouse embryonic fibroblasts. Shown are representative experiments reproduced twice.

