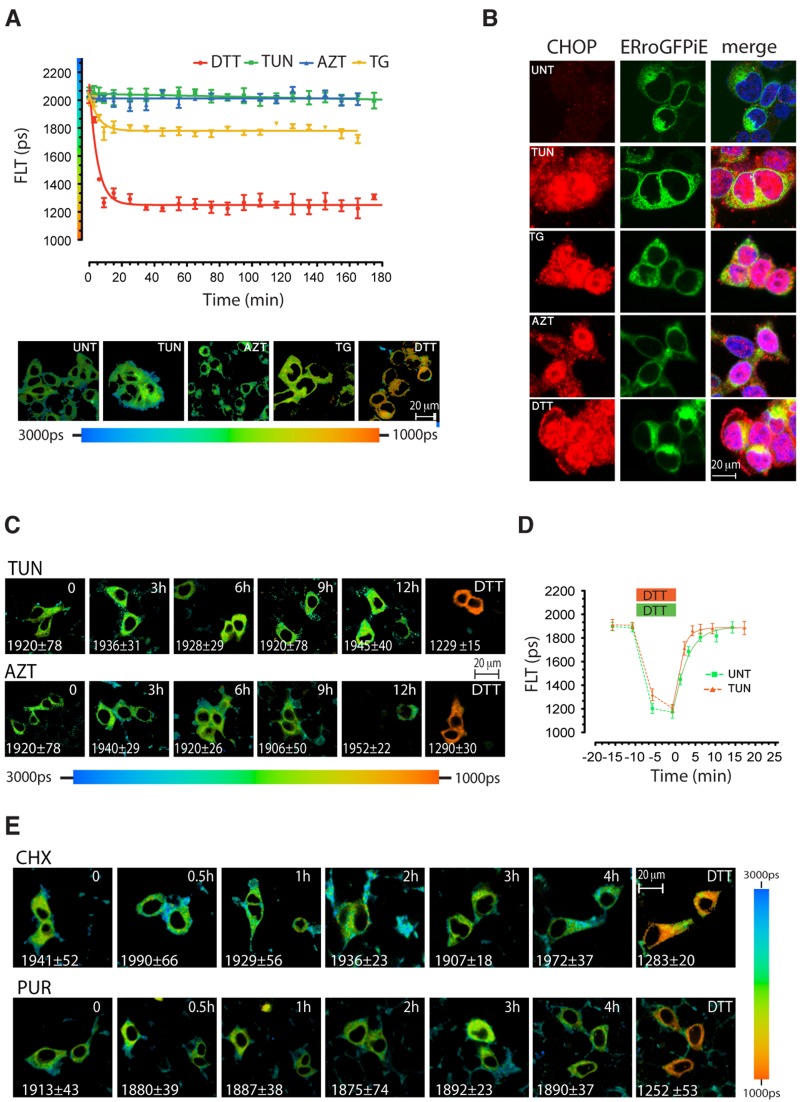
Figure 5.
Fluorescence lifetime of ERroGFPiE is unaffected by physiological levels of unfolded protein stress. (A) A trace of time-dependent changes in ERroGFPiE fluorescence lifetime in live HEK 293T cells after exposure to 2 mM DTT, 5 µg/ml tunicamycin (TUN), 3 mM azetidine (AZT), or 2 µM thapsigargin (TG). Color-coded fluorescence lifetime images of cells 3 h into the exposure are shown in the bottom panel. Each data point represents the mean ± SD of fluorescence lifetime measured in ≥10 cells. (B) Fluorescent photomicrographs of cells as in A, immunostained for the ER stress–induced nuclear protein CHOP (left), GFP (middle), and a superposition of the two images with Hoechst nuclei staining (right). (C) Extended time course of color-coded fluorescence lifetime images of ERroGFPiE expressing live HEK 293T cells exposed to tunicamycin or azetidine. (D) A trace of time-dependent changes in ERroGFPiE fluorescence lifetime in untreated (green) and 3-h tunicamycin-treated HEK 293T cells (orange), before, during, and after brief exposure to DTT. (E) Extended time course of color-coded fluorescence lifetime images of ERroGFPiE expressing live HEK 293T cells exposed to 50 µg/ml of the protein synthesis inhibitors cycloheximide (CHX) or 10 µg/ml of puromycin (PUR). Shown are representative experiments reproduced twice.

