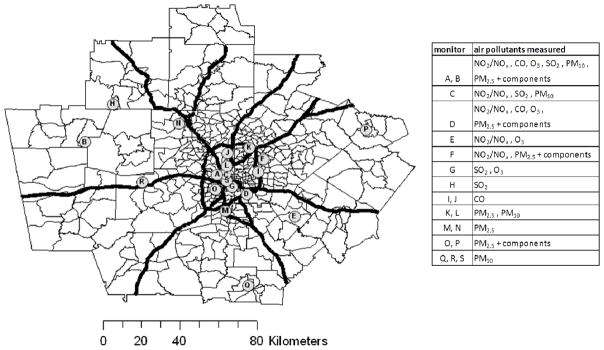
Figure 1.

Map of the 20-county metropolitan Atlanta study area. Census tracts, expressways, and ambient air pollutant monitoring sites are shown. The urban center was defined at the intersection of expressways near the monitor labeled S, and the central monitor was defined as monitor A, the EPA supersite location.
