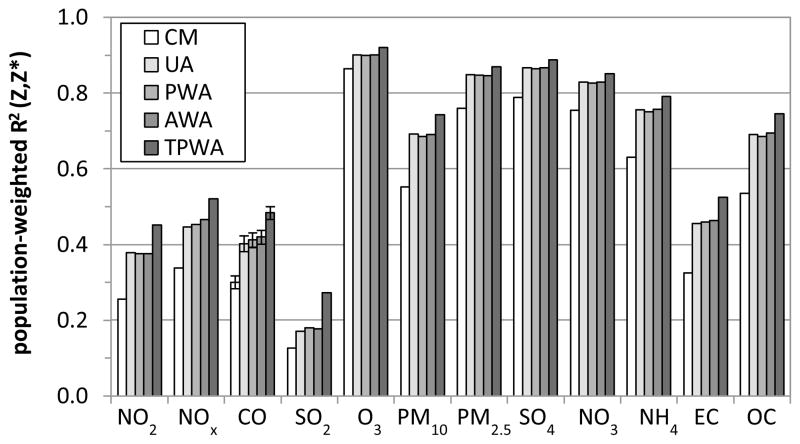
Figure 4.
Population-weighted R2 values between the true ambient concentration field and different exposure metrics, R2(Z,Z*), where the exposure metrics are the monitor-based metrics of central monitor (CM), unweighted average (UA), population-weighted average (PWA) and area-weighted average (AWA), as well as the true population-weighted average (TPWA). Standard deviations of 10 sets of CO simulations are shown.

