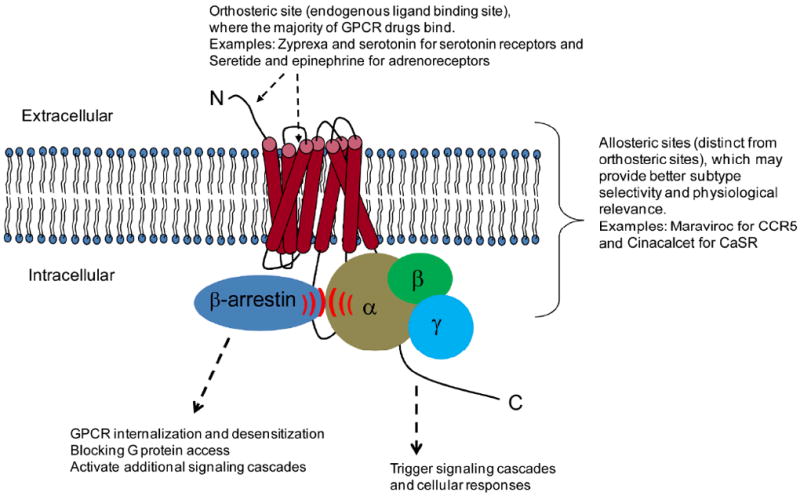
Figure 1. Schematic diagram shows a GPCR and possible ligand binding sites.

Orthosteric sites are usually at the outer surface of the receptor and sometimes in the extracellular N-terminus region. Allosteric sites are distinct from the orthosteric sites and can be located in any region of the receptor. GPCRs bound to G proteins vs. arrestins show differential signaling behaviors.
