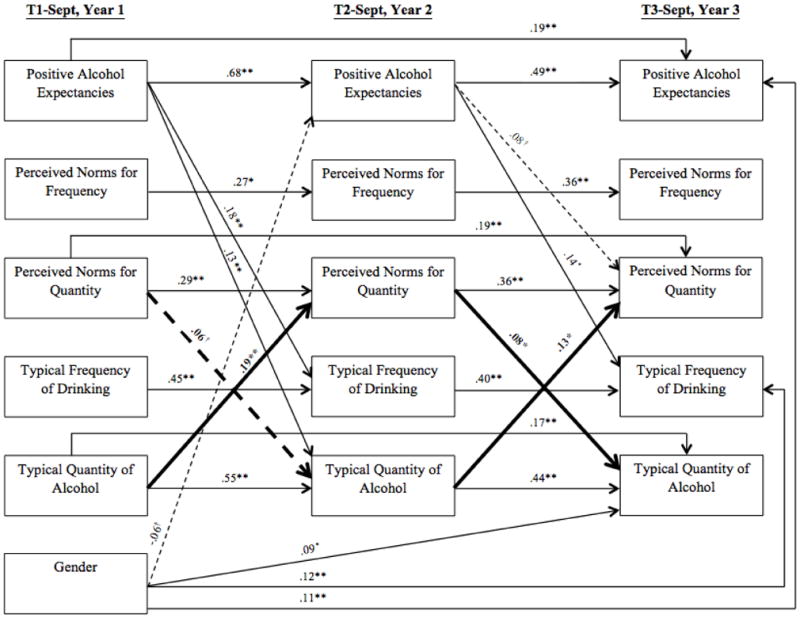
Figure 1.

Cross-lagged panel model of associations among PAEs, norms, and alcohol use. All cross-lagged paths between PAEs, norms, and alcohol use are estimated. Only paths with significant or marginally significant coefficients are shown. Standardized path coefficients are displayed. Solid lines indicate paths that are significant at the .05 level and dashed lines indicate paths that are marginally significant (0.5 < p < .10). Bolded lines indicate the presence of significant reciprocal influences
