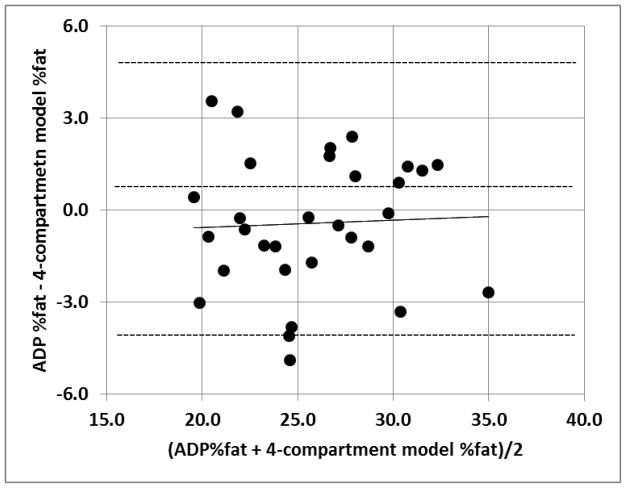
Figure 4.
The Bland Altman. The middle dashed line represents the mean difference between %fat from ADP − %fat from the 4-compartment model and the upper and lower dashed line represents ± 2 SD from the mean. The solid line is the regression line. No bias between the techniques was observed, as indicated by a non-significant p value (p = 0.81).

