
Figure 5.
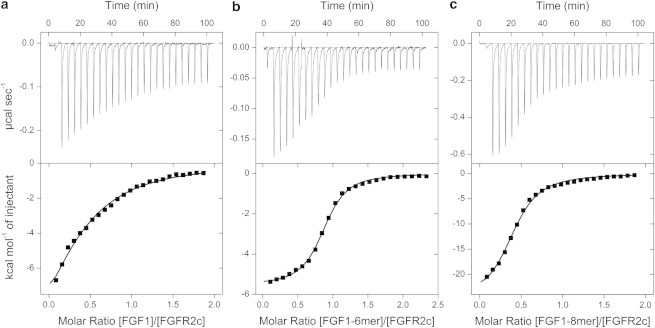
ITC analysis of FGF1 binding to FGFR2c in the absence (a) and presence of heparin hexa- (b) and octasaccharide (c). To determine the interaction between FGF1 and FGFR2c, 100 μM FGF1 was titrated into 10 μM FGFR2c. For panel b, 125 μM complex of FGF1–6-mer preincubated in a 1:1 ratio was titrated into 10 μM FGFR2c and for panel c, 100 μM FGF1–8-mer complex was titrated into 10 μM receptor. Trace of calorimetric titration (upper panel) and integrated isotherms (lower panel). (Solid lines) Best fit to a one-site model. For analysis of the FGF1-FGFR2c titration, n was fixed as 1.0.