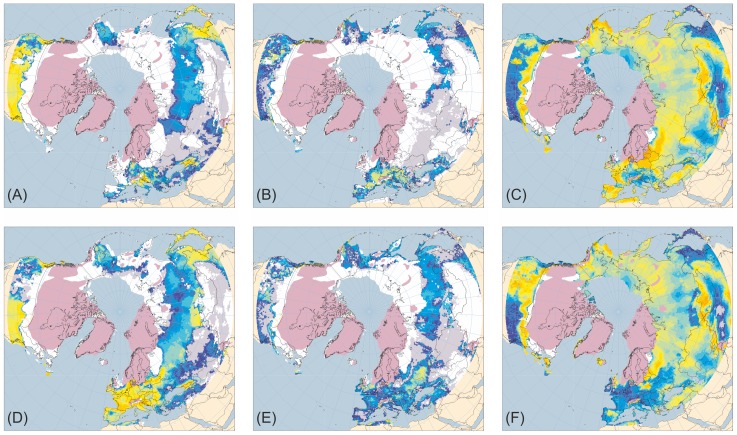
Figure 3. Tree, shrub and herb plant functional type ANPP: Heinrich Event 3 hosing experiment compared to 32 ka BP normal experiment.
ANPP for the aggregated tree (A and D), shrub (B and E) and herb (C and F) plant functional types (PFTs) simulated for the palaeoclimates generated by the Heinrich Event 3 hosing experiment (A–C) and the equivalent 32 ka BP normal experiment (D–F). Lilac shaded areas indicate the extent of the ice sheets mapped for the mid-Weichselian [41]; land area is shown for sea-level lowered by 80 m [40]. ANPP is indicated by shading of land areas: white areas have zero ANPP for that PFT; pale grey areas have non-zero but very low ANPP; shades from deep blue through cyan and pale cyan to yellow and orange indicate progressively higher ANPP (for quantitative legend see Fig. 1).

