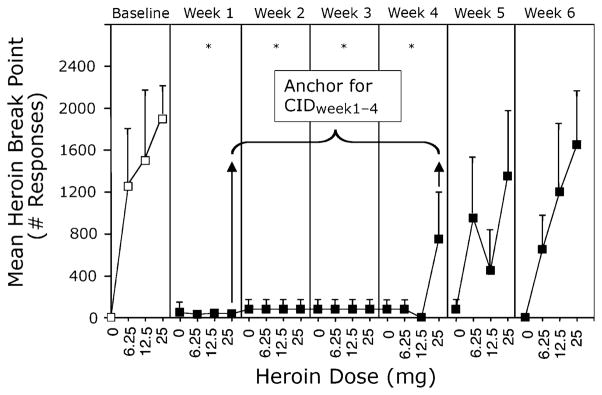
Fig. 2.

Self-administration of heroin. Self-administration of IV heroin as a function of heroin dose (0–25 mg) and week at baseline (white squares) and following 384 mg depot NTX (black squares). Asterisks indicate a significant difference in mean heroin break point values across heroin dose conditions for a given week versus baseline. The data points for heroin self-administration behavior between Week 4 and Week 1 labeled as “Anchor for CIDWeek1–4” indicates that these observations provide clinically relevant justification (anchor) for the parameters chosen in the Comer et al. [10] study. With kind permission from Springer Science + Business Media: Psychopharmacology, Sullivan et al. [12] © Springer-Verlag 2006
