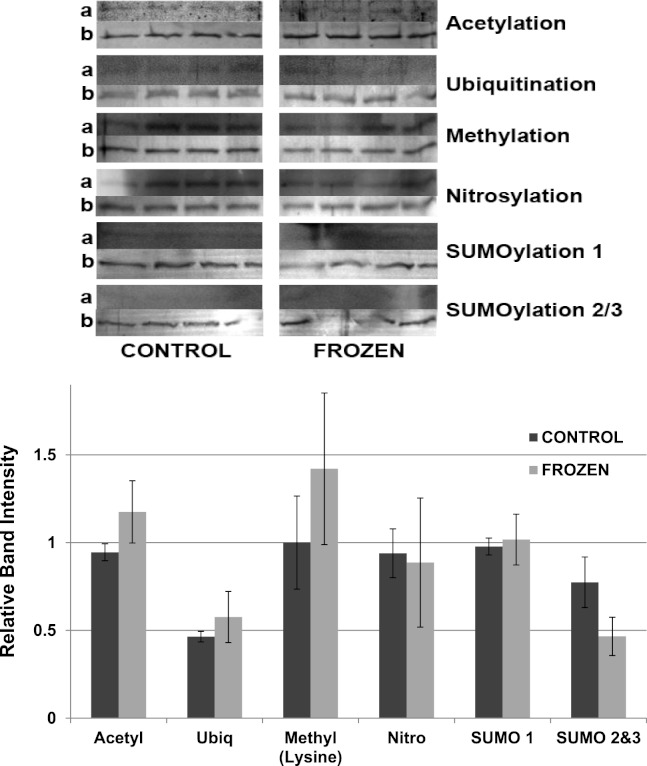
Figure 10. Posttranslational modifications of purified muscle LDH from control and 24 h frozen frogs.
Equal amounts of protein were loaded into each lane of SDS-PAGE gels. Immunoblot band density in each lane was normalized against the density of the same band when restained with Coomassie blue. The upper portion of the figure shows representative bands for gels exposed to each type of antibody: anti-acetyl, anti-ubiquitin, anti-methyl, anti-nitrosyl, anti-SUMO 1 and anti-SUMO 2/3. The histogram shows relative band intensities, mean ± SEM, n = 4 independent determinations. Images labeled “a” show the immunoblot chemiluminescence; images labeled “b” show the corresponding Coomassie blue stained bands.

