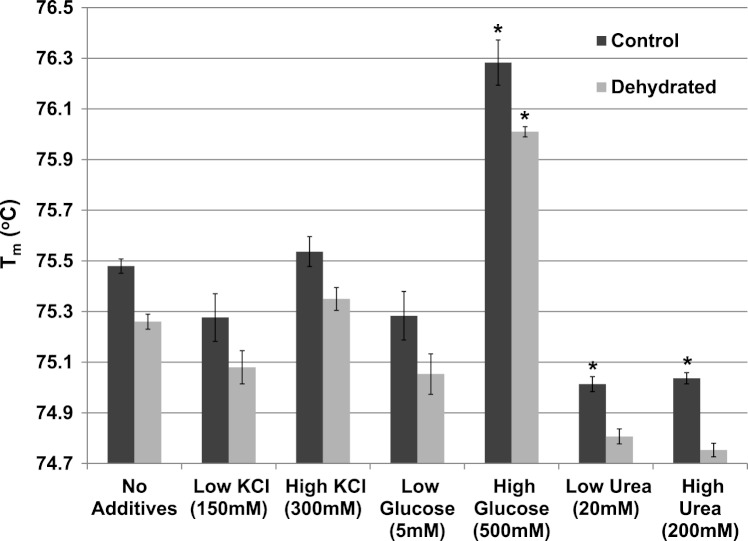
Figure 7. The effect of various additives (KCl, glucose, urea) on the Tm of purified LDH from muscle of control and dehydrated wood frogs.
Data are means ±SEM, n = 3 independent determinations. * – significantly different from the same animal state without additives using one-way ANOVA and Tukey’s Post Hoc test, p < 0.05.

