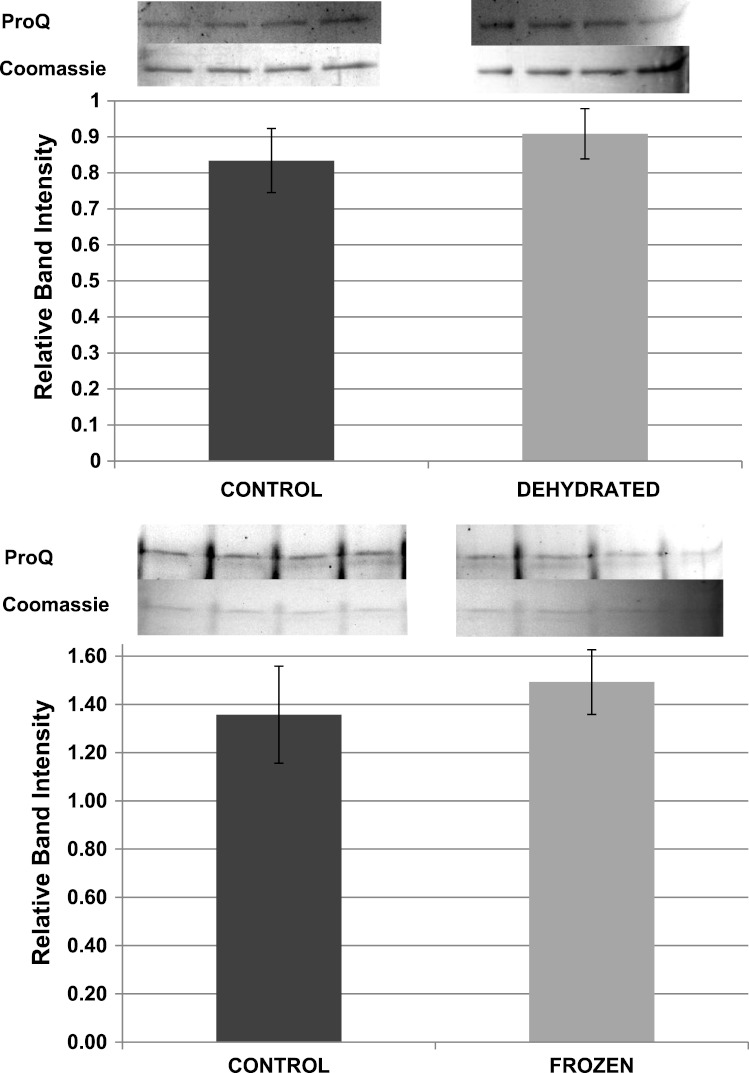
Figure 9. Relative phosphorylation levels of purified muscle LDH from control, frozen and dehydrated frogs.
Equal amounts of protein were loaded into each lane of SDS-PAGE gels. ProQ Diamond band density in each lane was normalized against the density of the same band when restained with Coomassie blue. The histogram shows mean ± SEM, n = 8 independent determinations. Four representative bands from the ProQ Diamond and Coomassie blue stained gels are shown above each histogram.

