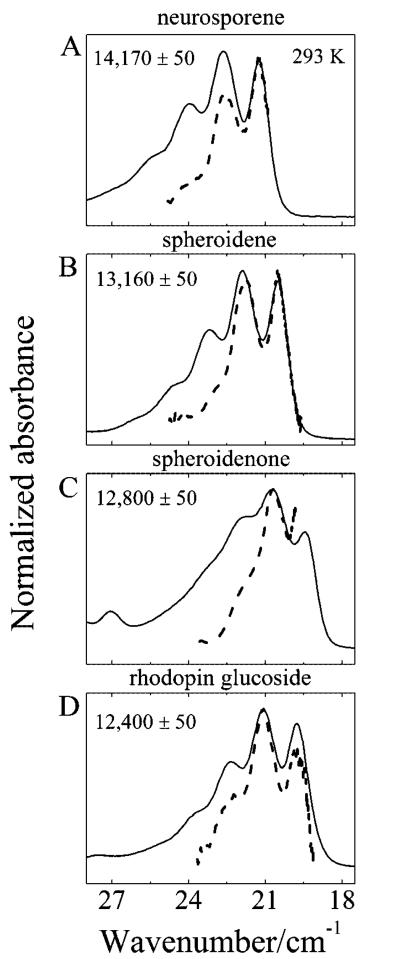
Figure 10.
Overlay of the steady-state S0 (11Ag−) → S2 (11Bu+) absorption (solid line) and the S1 (21Ag−) → S2 (11Bu+) transient absorption (dashed line) shifted from the NIR region by the indicated amount of energy in cm−1 units. (A) neurosporene, (B) spheroidene, (C) spheroidenone, and (D) rhodopin glucoside. All spectra were taken at 293 K in acetone except spheroidenone, which was measured in hexane.

