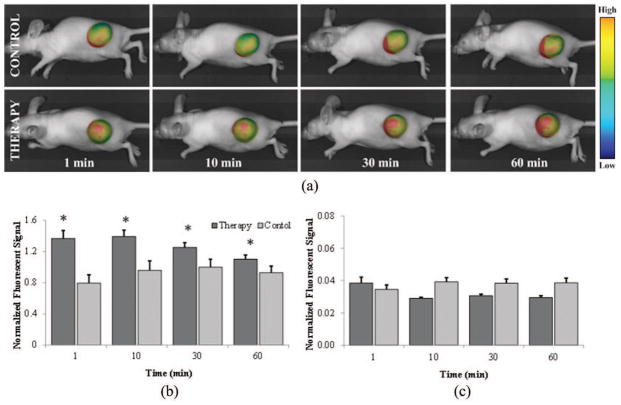
Fig. 3.
Optical monitoring allows intratumoral analysis of fluorescent tracer accumulation. The mean fluorescent signal from each tumor location is normalized by tumor size. (a) Representative images of therapy and control animals at 1, 10, 30, and 60 min after microbubble-mediated ultrasound therapy exposure and/or fluorescent tracer dosing. Summary of fluorescent image temporal measurements from therapy and control tumors for the (b) small molecular and (c) large molecular trace-dosed animals.

