
Fig. 4.
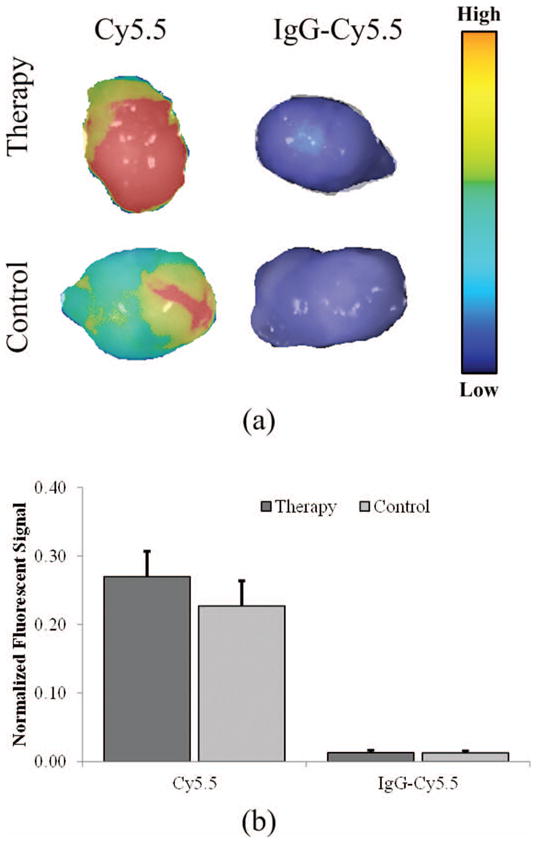
Tumor samples analyzed ex vivo for fluorescent signal detection. (a) Representative tumor images are shown for the small (Cy5.5) and large (IgG-labeled Cy5.5) molecular tracer exposed samples. (b) Differences in fluorescent signal from ex vivo samples (normalized by pixels in the region-of-interest).