
Figure 2.
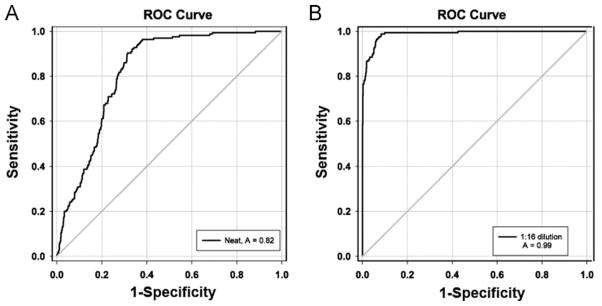
Receiver–operator characteristic curve analysis examining the ability of a mean fluorescent intensity (MFI) value from conventional single-antigen bead testing using (A) undiluted sera or (B) sera diluted 1:16 to predict a positive C1q test value (MFI >500). A better area under the curve (AUC) was found using the 1:16 diluted sera (AUC = 0.988) compared with the undiluted sera (AUC = 0.821).