
Fig 3.
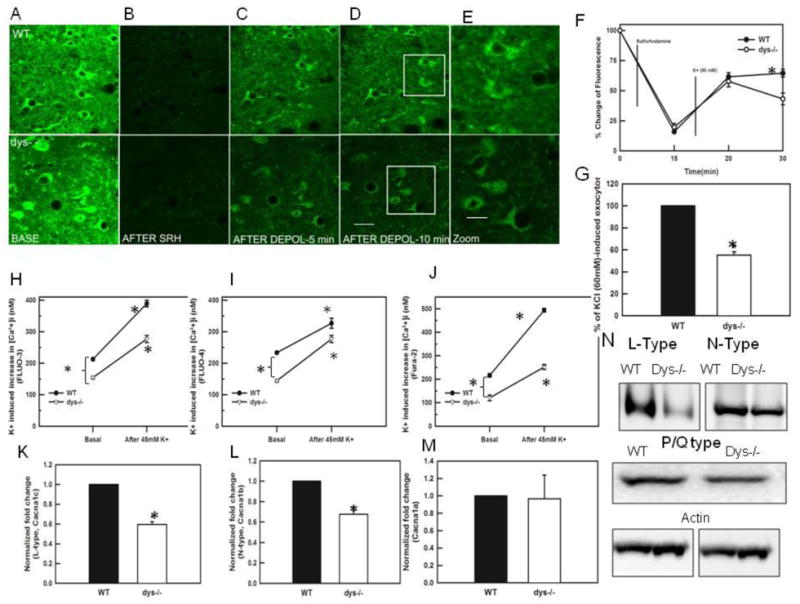
FM1-43 labeling of PFC slices in dysbindin-1 WT and dys −/−mice. A) PFC brain slices 250 μm thick from young animals were loaded with FM1-43 (8 μM) for 15 min, washed 10–15 minutes with perfusion buffer and imaged immediately B) the slices were perfused with sulforhodamine (SRH100 μM) for 15 min. The picture shows the representative quenching of the FM1-43 fluorescence, revealing the underlying synaptic labeling. C-D) Time course showing the loss of FM 1–43 fluorescence during high K+ (90 mM) depolarization. A significant decrease in labeling between WT and dys −/− mice can be observed after 15 minutes of depolarization with high K+ (total time =30 min). Scale bar = 50 μm, E) High magnification (400 X) of the inserts in D, showing the FM1-43 labeling in dysbindin-1 WT and dys −/− mice. (Scale bar = 20 μm). F) Graph showing the pooled data (WT n=15 cells, 7 animals and dys −/− = 17 cells, 9 animals) illustrating changes in FM1-43 fluorescence content. After 15 minutes of depolarization with high K+ there was significant decrease (p<0.001) in the fluorescence in dys −/− PFC. The abscissa axis depicts total times in minutes G) Flourometric quantification of synaptosomal FM1-43. The graph shows that dys −/− mice exhibit a significant decrease (p< 0.001) in % of KCl (60 mM)-induced exocytosis (n=4 animals/genotype) 15 minutes after the depolarization. H) graph showing the change in synaptosomal [Ca2+]i measured with FLUO-3, dys −/− mice show significantly lower basal levels of [Ca2+]i (*p< 0.008), following depolarization with 45 mM K+, the [Ca2+]i levels increased in WT significantly (*p=0.001) as well as in dys −/− mice (*p=0.001), I) Graph showing the change in synaptosomal [Ca2+]i measured with FLUO-4. Dys −/− mice exhibits significant decreases in basal levels (*p<0.001). High K+ stimulation increased significantly the [Ca2+]i levels in dys −/− mice (*p< 0.002) and WT mice (* p <0.006). J) We also assessed [Ca2+]i levels using the radiometric indicator (Fura-2) in the synaptosomal preparation. Dys −/− mice showed significantly lower baseline values (WT: 216.11 ± 7.27; dys −/−: 120.4 ±12.02, *p<0.001, Fig. 3J). Following depolarization with 45 mM K+, dysbindin-1 WT and dys −/− mice show a 228% and 209% increase in Ca2+ levels respectively (WT: 228%, 493.4 ± 7.70 dys −/− 251.8 ± 103, * p< 0.001. K) Using Western Blots to measure the levels of L-type Ca2+ channel protein, we found a significant decrease in dys −/− mice (* p< 0.02), L) Western Blots assessing levels of N-type Ca2+ channels lassos show a significant decrease in in dys −/− mice (*p<0.001). M) Western Blots did not show changes in the levels of P/Q–type Ca2+ channels between WT and dys−/− mice. N) Western blots showing the decreases in N- and L-type Ca2+ channels in dys −/− mice.