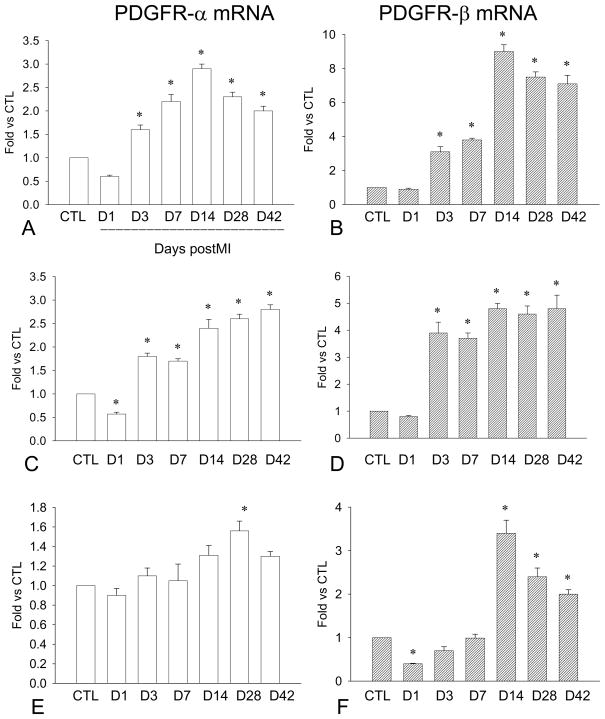
Figure 6.
Cardiac PDGFR gene expression: Compared to controls, PDGFR-α mRNA was significantly increased in the border zone (panel A) and infarcted myocardium (panel C) in both early and late stages of MI, whereas levels were only increased in the noninfarcted myocardium in the late state of MI (panel E). Similarly, PDGFR-β mRNA was increased in the border zone (panel B) and infarcted myocardium (panel D) in the early and late stage of MI. PDGF-β mRNA was elevated in the noninfarcted myocardium after week 2 (panel F).

