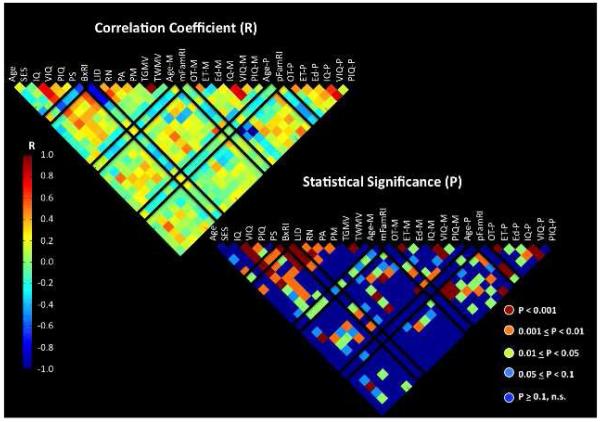
Figure 1. Associations among familial risk index (FamRI), behavioral risk index (BxRI) (marked in black boxes) and various demographic, behavioral and brain measures.
Upper left figure represents correlation coefficients (R) and lower right represents significance level (P). Black boxes are shown to easily identify factors that are associated the FamRI and BxRI. In the lower right, comparisons in red (p<0.001) are those that are significant even after Bonferroni correction. Age: child’s age in years, SES: socioeconomic status, IQ: Woodcock Johnson III brief intellectual ability standard score (-ss), VIQ: Woodcock Johnson III verbal comprehension-ss, PIQ: Woodcock Johnson III concept formation-ss, LID: WRMT Letter ID subtest -ss, RN: rapid automatized naming color and object subtests average –ss, PA: phonological awareness composite score of CTOPP, BxRI: composite measure of PA, RN and LID, PM: phonological memory composite score of CTOPP, TGMV: total grey matter volume, TWMV: total white matter volume, Age-M: maternal age, mFamRI: maternal ARHQ score, OT-M: percent overall maternal time with child, ET-M: percent of maternal educational time with child, Ed-M: maternal educational level, IQ-M: maternal estimated full-scale IQ from WAIS-R, VIQ-M: maternal estimated verbal IQ from WAIS-R, PIQ-M: maternal estimated performance IQ from WAIS-R, -P refers to parental scores. For example, one can see that BxRI is negatively correlated LID, RN, and PA (all p’s<0.001). mFamRI is significantly correlated with many other measures in the figure, but pFamRI is not significantly correlated with these measures except for IQ-P, VIQ-P, PIQ-P and child’s VIQ.

