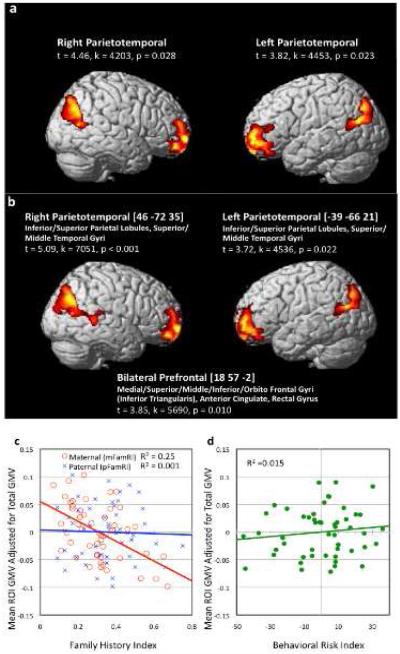
Figure 2. Association between regional brain volume and maternal Family Risk Index [mFamRI; FamRI is equivalent to Adult Reading History Questionnaire (ARHQ) scores].
a. Brain regions where there were significant negative association between grey matter volume (GMV) and mFamRI (p<0.05 corrected). Main region and statistical values (t-values, cluster size in voxels [k] and p values) are listed.
b. Brain regions where there were significant negative association between GMV and mFamRI. Total GMV and Behavioral Risk Index (BxRI; defined as a composite of letter identification, rapid naming and phonological awareness scores) were entered as nuisance variables (p<0.05 corrected). Main region, peak Talairach coordinates, anatomical structures the clusters extend to, and statistical values (t-values, cluster size in voxels [k] and p values) are listed.
c. Visual representation of correlations between FamRI and mean regional GMV of all significant clusters in Fig 1b combined and adjusted for total GMV and BxRI. Results were similar for each cluster hence are combined here.
d. Visual representation of correlations between BxRI and mean regional GMV of all significant clusters in Fig 1b combined and adjusted for total GMV and mFamRI. Results were similar for each cluster hence are combined here.

