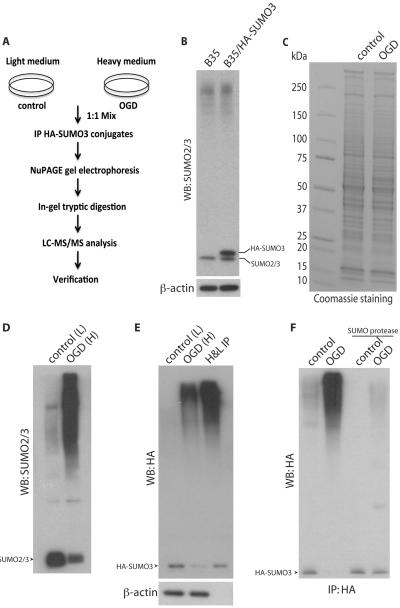
Figure 2.
SUMO proteomic analysis. (A) Scheme of experimental procedures. Cells were cultured in light (control) or heavy (OGD) medium, proteins extracted and identical amounts mixed. HA-tagged SUMO3 conjugated proteins were immunoprecipitated and separated by SDS-PAGE. After in-gel tryptic digestion, samples were analyzed using LC-MS/MS. Proteomics data were verified for individual proteins by immunoprecipitation of control and OGD extracts followed by SUMO protease exposure and immunoblotting using the appropriate antibodies. (B) In the B35/HA-SUMO3 stable cell line used in this study, overexpression of HA-SUMO3 did not result in a global increase in levels of SUMO conjugated proteins. To verify that identical protein levels of extracts from light and heavy cultures were mixed, samples were loaded onto a SDS-PAGE gel and proteins were visualized by Coomassie staining (C). Extracts from control (L) and OGD (H) samples and anti-HA immuoprecipitates from equal amounts of combined extracts were separated by SDS-PAGE and detected with anti-SUMO2/3 antibody (D) and anti-HA antibody (E) by Western blotting (WB). (F) HA-SUMO3 conjugated proteins were purified from control and OGD extracts separately and incubated with or without SUMO protease. Samples were subjected to Western blot analysis with anti-HA antibody. Free SUMO is indicated by arrowhead. IP, immunoprecipitation.

