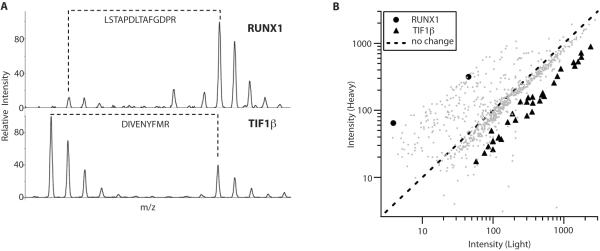
Figure 3.
Mass spectrometry-based quantification of SUMO conjugation via SILAC approach. . (A) Representative SILAC peptide pairs for an upregulated protein (RUNX1) and a downregulated protein (TIF1β). Peptide identifications are included in the figure, and associated m/z and intensity information in Table S1. (B) Non-normalized ratio plot including all quantified peptides in the experiment, with 2 peptides from RUNX1 and 31 peptides from TIF1β in black and peptides from the other 186 proteins in grey.

