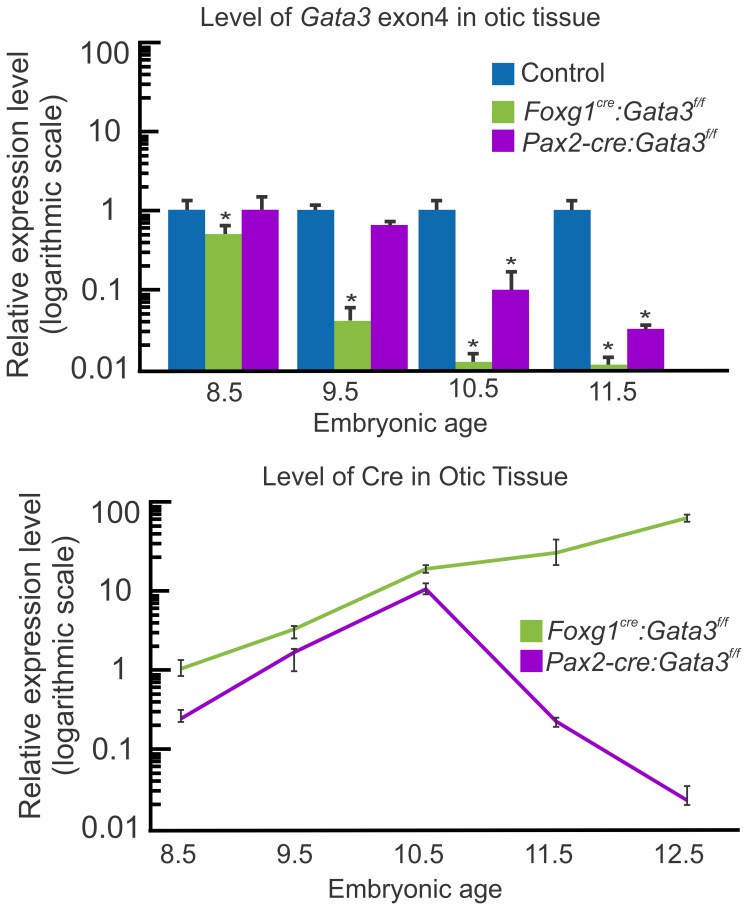
Figure 1. Gata3 recombination.
The top panel, using qRT-PCR, shows the relative level of recombined Gata3 exon4 in the inner ear of both Cre lines compared to control (set to 1, for each age group). There is an earlier and more effective recombination of the Gata3 floxed allele in Foxg1Cre ears than in Pax2-Cre. Pax2-Cre ears first show a significant reduction in Gata3 exon4 at E10.5 two days after Foxg1Cre. This is correlated with the timing of sensory vs non-sensory specification in the ear. The lower panel shows a comparison of Cre expression levels, using qRT-PCR, between Foxg1Cre: Gata3f/f and Pax2-Cre:Gata3f/f ears. Cre expression levels are relative to the level of Cre mRNA in Foxg1Cre: Gata3f/f ears at E8.5 (set to 1). The scale on the left is logarithmic. Pax2-Cre mRNA expression levels are 8-fold less at E8.5 than Foxg1Cre. All data represent 3 biological replicates and 3 technical replicates per-time point as per MIQE guidelines [50]. *p<.01, students t-test.

