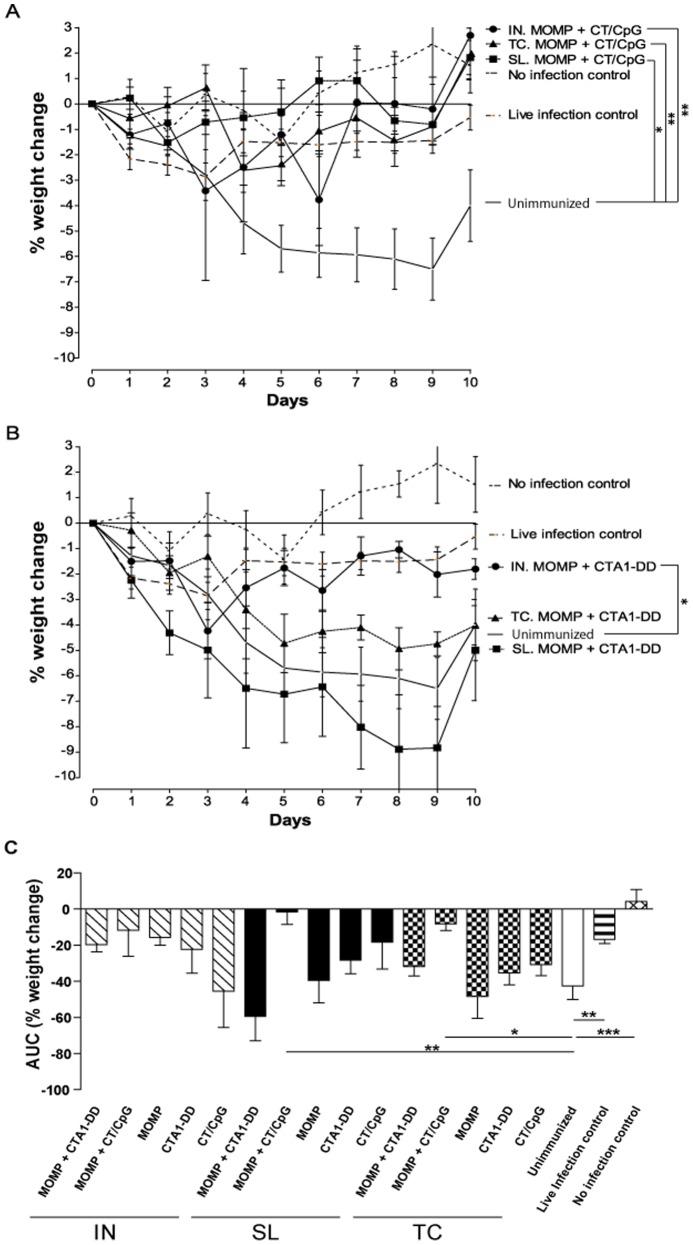
Figure 1. Percentage weight change of animals following IN challenge with C. muridarum.
Percentage weight change was calculated by comparing the pre-infection body weight to daily p.i body weights. The figure depicts the effect of vaccination with MOMP and (A) CT/CpG- or (B) CTA1-DD-based vaccines on weight loss following IN challenge infection. Unimmunized (primary infection), live infection (secondary infection) and no infection controls are also included. (C) Area under the curve (AUC) analysis of percentage weight change was the total area, of both negative and positive peaks in weight change, over the 10 day course of infection in arbitrary units. Results are presented as the mean ± SD. Significant differences were determined using a one-way ANOVA with Tukey’s post-test by comparing the weight changes between groups at the same point in time. One P value, the most significant, is given for groups showing a significant change. Significance was set at P<0.05 for all tests. P>0.05 (not shown), 0.01–0.05 (*), 0.001–0.01 (**) and <0.001 (***).

