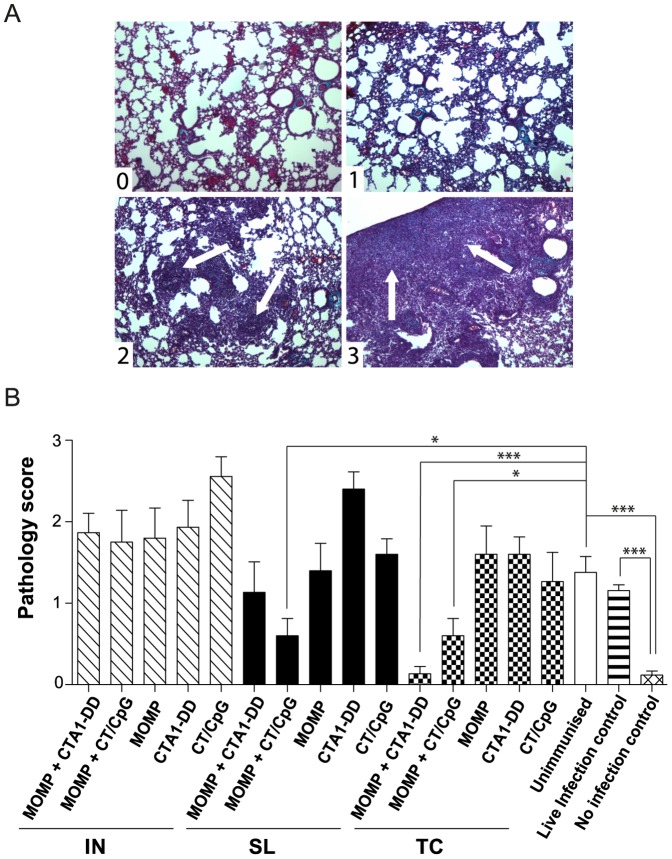
Figure 3. Fibrotic scarring and lung consolidation following IN infection with C. muridarum.
Lung tissues collected at day 10 p.i were paraffin embedded, sectioned and stained using Masson’s trichrome. (A) The pathology score scale used to compare the development of disease following infection. Representative histological images for each pathology scores are depicted. “0” signifies healthy, undamaged lung tissue. Scores of “1” through to “3” depict worsening degrees of collagen deposition (blue) and the beginnings of obstruction and consolidation of the lungs (white arrows). Pathology can also be seen on a macroscopic level, when comparing healthy (left) and fibrotic (right) lobes of the lungs. (B) Average pathology scores, determined by three separate individuals blinded to groups and experimental design. Results are presented as the mean ± SD. Significant differences were determined using a one-way ANOVA with Tukey’s post-test. Significance was set at P < 0.05 for all tests. P >0.05 (not shown), 0.01–0.05 (*), 0.001–0.01 (**) and <0.001 (***).

