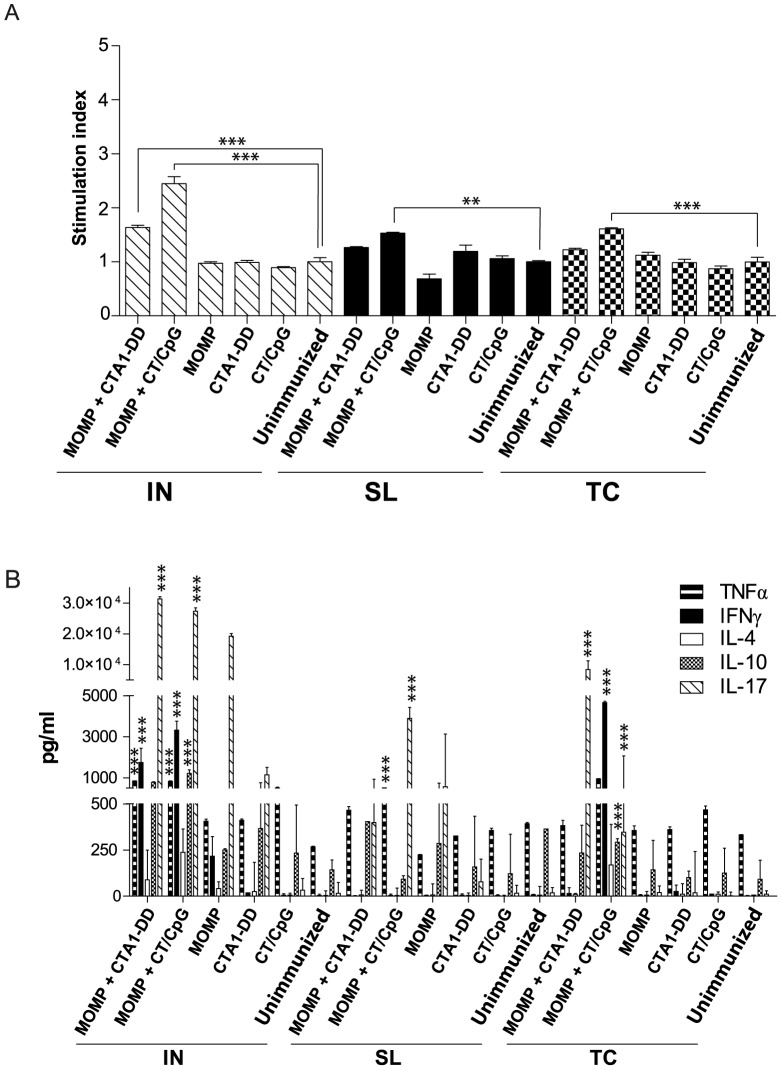
Figure 4. Proliferation and cytokine production by lymphocytes isolated from the spleen and stimulated with MOMP.
Splenocytes were stimulated with MOMP or media for 72 hr. (A) Lymphocyte proliferation was determined by addition of thymidine for an additional 14 hr. Data are expressed as stimulation index (cpm of the MOMP stimulated cells divided by the cpm of media stimulated cells). (B) The amount of TNFα, IFNγ, IL-4, IL-10 and IL-17 (pg/mL) secreted by splenocytes following stimulation was quantified using Bioplex® and ELISA. Results are presented as the mean ± SD. Significant differences were determined using a one-way ANOVA with Tukey’s post-test. Significance was set at P<0.05 for all tests. P>0.05 (not shown), 0.01–0.05 (*), 0.001–0.01 (**) and <0.001 (***).

