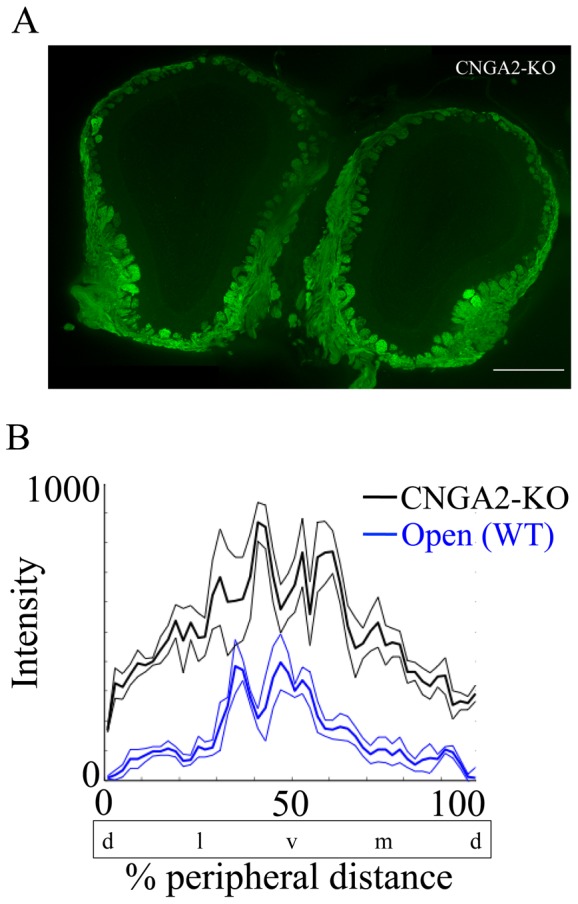
Figure 4. CNGA2 knockout OB shows wider distribution of glomeruli displaying GFP immunofluorescence that differs from the WT OB.

A shows a representative coronal section of the OB of CNGA2 knockout/TRPM5-GFP mouse (CNGA2 KO in the figure). Eighteen µm OB section was immunoreacted with antibody against GFP (green, scale bar = 500 µm). B shows the mean fluorescence intensity around the glomerular layer as a function of percent peripheral distance from the dorsal most point. Thin lines represent the SEM. The CNGA2 knockout OB (black) significantly differs from the open side of naris occluded OB (blue) of TRPM5-GFP animals (Open in the figure). (two way ANOVA for CNGA2 knockout/TRPM5-GFP vs. TRPM5-GFP open naris F (1,49) = 189, p<0.0001, n = 4–6). % peripheral distance was measured starting from the dorsal most point. d = dorsal, l = lateral, v = ventral, m = medial.
