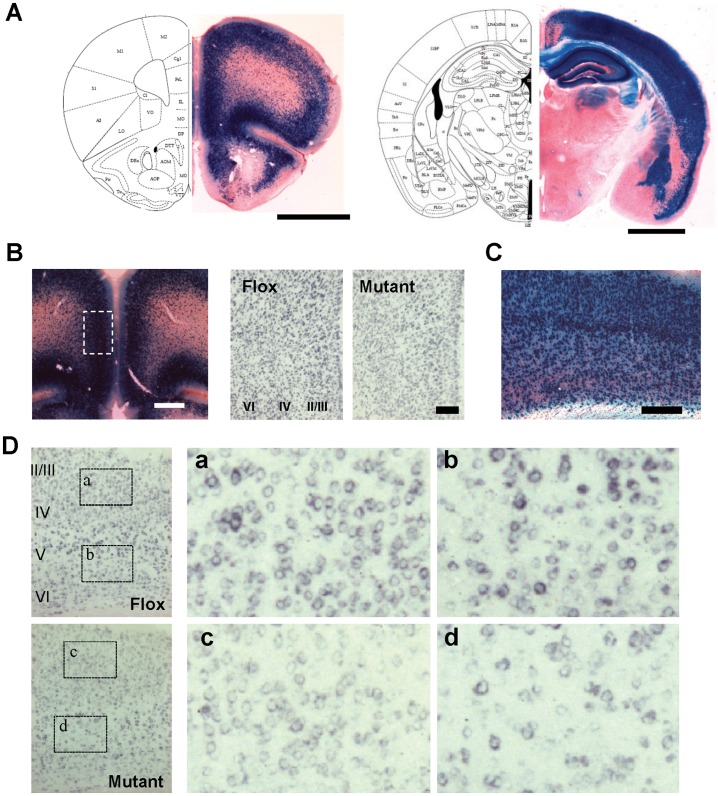
Figure 1. Histological characterization of cortical excitatory neuron-selective GluN1 knockout mice.
A. Spatial distribution of Cre recombinase activity in coronal sections of G35-3-Cre/R26lacZ mice, stained with X-gal (blue) and Safranin-O. B. High magnification photographs in the medial prefrontal cortex (mPFC). Left, X-gal staining of G35-3-Cre/R26lacZ mice. Right, in situ hybridization images with DIG-labeled GluN1 cRNA (blue) in the mPFC region corresponding to the dotted area in the X-Gal staining image. C and D. High magnification photographs in the primary sensory (S1) cortex. X-Gal staining image in C, and in situ hybridization images with DIG-labeled GluN1 cRNA (blue) in D. Right panels, a to d, are shown from the dotted areas in the left panels from floxed-GluN1 control (Flox) and mutant mice, respectively. All mice were 11 weeks of age. Scale Bar: 200 µm.

