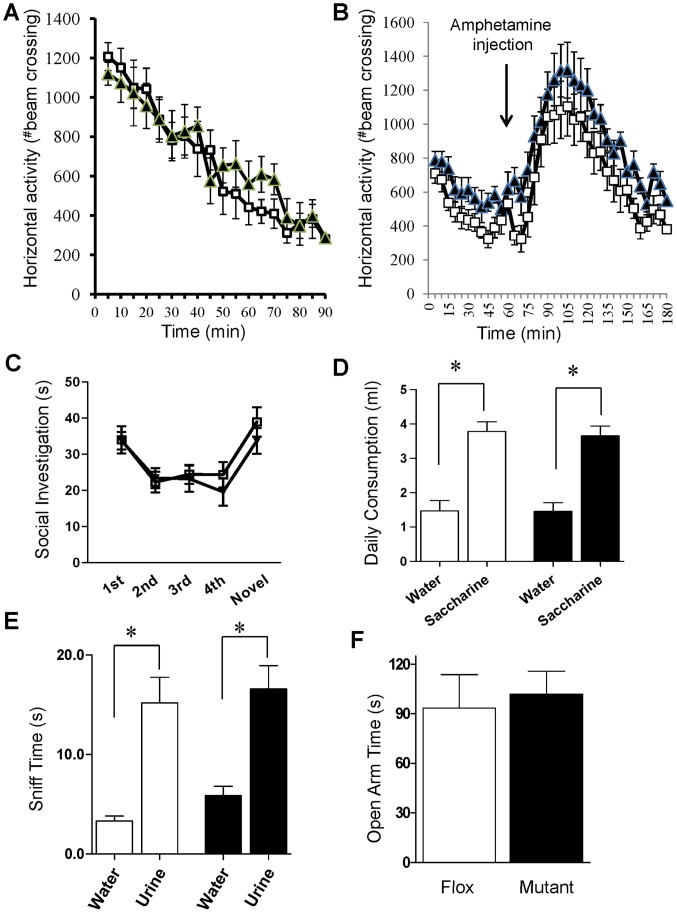
Figure 6. Positive and negative-like phenotypes.
A. In the novel open field test, no difference in horizontal activity between mutant (black triangle, n = 8) mice and Flox (while square, n = 14) controls (two-way repeated measures ANOVA; p = 0.56). B. No significant difference for genotype (black for mutant (n = 9), white for Flox (n = 9)) in amphetamine-induced locomotor response (two-way repeated measures ANOVA after treatment; p = 0.12). C. No difference between mutant (black, n = 10) and Flox (white, n = 12) mice in the social recognition task (two-way repeated measures ANOVA; p = 0.56). D. In the saccharine preference test, both genotypes consumed saccharine more and no difference between mutant (black, n = 11) and Flox (white, n = 12) mice in saccharine preference (two-way ANOVA/LSD post-hoc test; p = 0.74). E. Mutant mice (black bar, n = 8) performed similarly to Flox controls (while bar, n = 9) in the female urine sniffing test (two-way ANOVA/LSD post-hoc test; p = 0.59). F. Mutant mice (n = 12) were comparable to flox controls (n = 11) in time spent in the open arm of the elevated plus maze (two-tailed t-test; p = 0.73).

