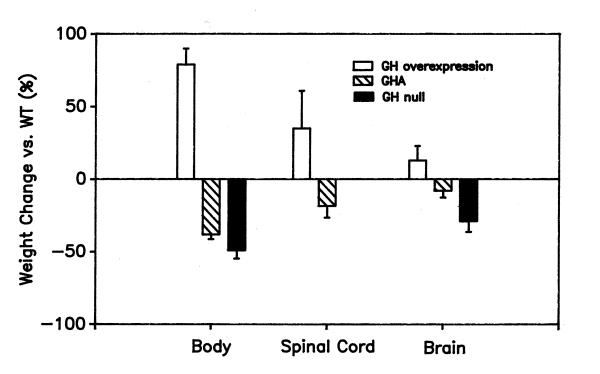
Figure 6.

Comparison of body and CNS growth in transgenic mice with increased and decreased GH action Mean percent changes (± SD) reported for GH+ [7] and GH null mice [6,11] are compared with data from the present study. The average age of the mice was 65 ± 9 days. Note that the rank order of GH and GHA effects on growth is the same in all three experimental situations.
