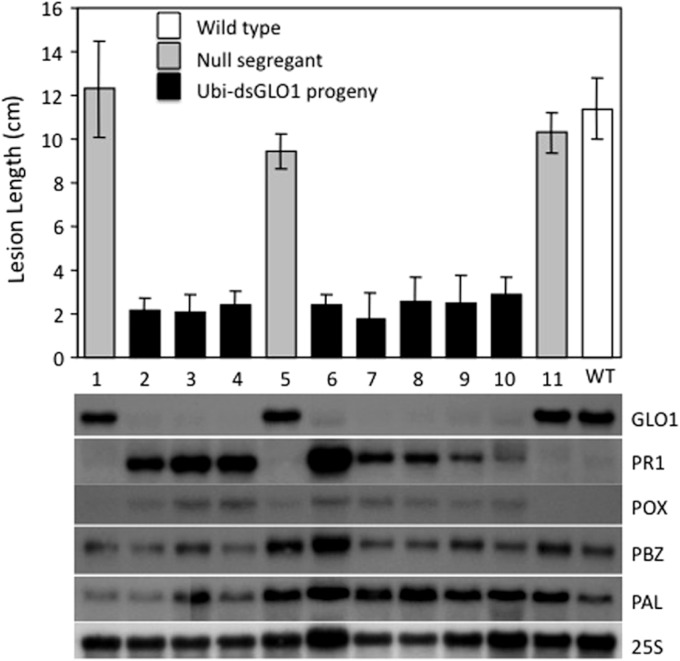
Figure 3. Segregation of resistance phenotype and RNA levels of GLO1 and defense-related genes.
Each plant (progeny of Ubi-dsGLO1 line #36) was genotyped for the presence of the Ubi-dsGLO1 transgene. Those containing the transgene are labeled Ubi-dsGLO1 (filled bars) and those missing the transgene labeled null segregants (grey bars). The Xoo induced lesion length of segregating progeny (labeled #1 to 11 under each bar) of Ubi-dsGLO1 and wild type LG (open bar) is plotted in the upper panel. The RNA levels detected by Northern analysis are displayed at the lower panel. The same progeny plant was used for analyses in the top panel and the bottom panel at the corresponding location. Each bar represents the mean and standard deviation of at least three leaves at the top panel.

