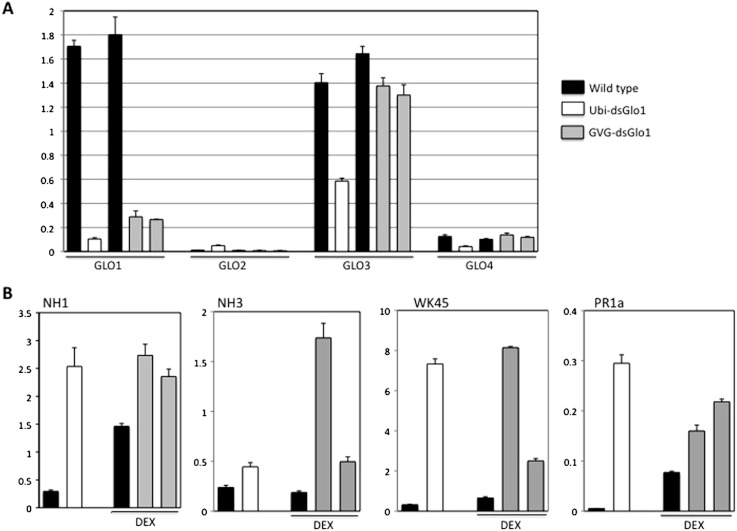
Figure 6. Real time RT–PCR of constitutive (Ubi-dsGLO1 line #36, open bars) and inducible (two progeny lines of GVG-dsGLO1 line #3, grey bars) silencing lines and their respective controls (LG and Kitaake).
The GVG-dsGLO1 and Kitaake plants were sprayed with DEX one day before collection of leaf tissues for RNA extraction. (Ubi-dsGLO1 and its control were not treated with DEX.) In each panel, the first two bars represent data of Ubi-dsGLO1 and LG control and the next three bars represent data of GVG-dsGLO1 and Kitaake control. (A) Specific primers targeting each of GLO1, GLO2, GLO3, and GLO4 were used for the four rice GLO genes to determine their RNA levels. (B) RNA levels of defense regulators NH1, NH3, and WRKY45, and defense marker gene PR1a were measured. Results were normalized to actin expression levels. Each bar represents the mean and standard deviation of three replicates.

