

Abstract
Many locomotor measures commonly used to assess functional deficits following neurological injury are velocity dependent. This makes the comparison of faster pre-injury walking to slower post-injury walking a challenging process. In lieu of calculating mean values at specific velocities, we have employed the use of nonlinear regression techniques to quantify locomotor measures across all velocities. This enables us to assess more accurately the locomotor recovery of rats after a cervical spinal cord injury. For example, while the mean stride length of the hindlimbs decreased following injury, regression analysis revealed that the change was due to the reduction in walking speed and not a functional deficit. A significant difference in the percent of the right forelimb step cycle that was spent in stance phase, or duty factor, was found across all velocities, however this deficit spontaneously recovered after 6 weeks. Conversely, no differences were initially found in hindlimb stride length, but abnormal compensatory techniques were found to have developed 3 weeks after injury.
Keywords: Locomotion, injury, functional deficits
1. Introduction
Following spinal cord injury, many aspects of rodent locomotion change (Hamers et al., 2006, Zörner et al., 2010). However, many of the locomotor measures used to assess changes in rodent gait are dependent upon the animal’s walking velocity (Hruska et al., 1979, Hruska and Silbergeld, 1979, Clarke and Parker, 1986, Koopmans et al., 2007, Majczyński et al., 2007). For example, a rodent takes short strides gradually when traveling slowly, and takes long strides rapidly when traveling fast. This inherent difference makes comparing pre-injury locomotor measures obtained at fast overground speeds to post-injury measures recorded at slow speeds a difficult process.
While the relationship between velocity and locomotor measures of quadrapedal gait has been well known for many decades (Heglund et al., 1974, Taylor 1978), recent advances in automated gait analysis devices have enabled researchers to quickly and easily obtain a multitude of overground locomotor measures (Hamers et al 2001, Tom et al., 2009). Unfortunately these devices merely obtain the data, it is still up to the investigator to rectify the issue of velocity dependence of locomotor measures. Many studies address this by restricting data analysis based upon classically defined cadences (Hildebrand 1989), so that galloping and trotting steps are excluded, and only walking steps are analyzed. Another common approach is to train the animals to complete the walking task at similar speeds (Deumens et al., 2007, Muir et al., 2007, Bozkurt et al., 2011). In practice these techniques generally mean that only walking trials that meet pre-determined limits of speed, cadence, or number of steps are compared whereas untold numbers of undesired walking trials are discarded.
It is our aim to compare all walking produced following neurological injury, to pre-injury locomotion. In the study presented here we investigated the locomotor behavior of rats before and after an asymmetrical spinal cord injury (C4/5 right overhemisection). In order to compare the locomotion before and after injury more accurately we did not compute mean locomotor measures of a constrained set of steps, nor did we excessively train or motivate the animals to complete the walking task at a pre-determined desired speed. Instead we let the animals walk at self selected speeds and used all recorded steps to generate nonlinear regression lines of velocity dependent locomotor measures. Many statistically significant differences were found when we simply compared the mean values of locomotor measures before and after injury (decreased stride length, increased cycle time and percent of the step cycle that was spent in stance phase, or duty factor). When we instead compared the velocity dependence of these locomotor measures, we found that some of the differences in mean values were the result of changes in animals walking velocity and not necessarily neurological impairment. Additionally, we showed that constraining the data analysis to compare only similar velocities yielded different results at different velocities, making the selection of a target velocity non-trivial.
Our analysis techniques were also used to track the changes in locomotion for up to seven weeks after spinal cord injury. With no treatment given, rats were able to spontaneously recover right forelimb locomotor function. Conversely, it was observed that the hindlimbs developed compensatory techniques that were not initially present following injury. Our technique of comparing locomotor measures at all velocities, and the knowledge that these measures spontaneously change in the weeks following injury, will be an essential tool in future studies analyzing the effects of specific rehabilitative treatments.
2. Material and methods
2.1 Animals
46 Adult female Sprague-Dawley rats, approximately 5 weeks old and 182±11g ( range of 160–212g) were used (Taconic Farms, Germantown, NY). Rats had unlimited access to food and water throughout the duration of the experiment while being housed in the Georgetown University Division of Comparative Medicine. All protocols were approved by the Georgetown University Animal Care and Use Committee.
2.2 Study Design
Rats were pre-trained on the CatWalk gait analysis system (Noldus Inc, NE) over a period of 3 non-consecutive days before pre-operative overground locomotion was recorded. The CatWalk consists of an internally illuminated glass runway (130 cm long and 10 cm wide) with a digital camera mounted underneath to capture the paw prints as the rats transverse the walkway. At no point during the experiment were rats motivated to complete the task via food deprivation or rewards. There were no time, animal velocity, or directional constraints placed on the trials. Animals were not required to complete a pass from one end of the walkway to the other. Trials were deemed complete once several walking steps were recorded from each limb. This could be accomplished from as few as 1 complete pass, or from several partial passes. In the case of partial passes, the first step of all four limbs immediately before and/or after any stopping or turning around was omitted, as these steps were not deemed as walking steps. Likewise, any trotting or galloping steps were omitted.
The rats then received a right overhemisection injury at the C4-5 level. The surgical techniques for this injury model have been previously described (Bregman et al., 1993–Lynskey et al., 2006). Briefly, rats were anesthetized with 4% chloral hydrate (0.01 cc/g intraperitoneally), a partial C4/C5 laminectomy was done, and iridectomy scissors were used to create a lesions at C4-5. The lesion transects the entire right side of the cord as well as the left dorsal column, which bilaterally ablates the dorsal corticospinal pathway, and unilaterally ablates the contralateral rubrospinal pathway. All lesion sites were reconstructed from serial cresyl violet sections at the end of the study, and only the 35 animals with appropriate injuries were included in post-injury analysis.
One week following injury, with no re-training, the overground locomotion of all rats was assessed with the CatWalk. A subset of 9 animals were then tested weekly for an additional 6 weeks starting on post-injury day 11 and ending on post-injury day 46 (hereafter referred to as weeks 2 through 7).
2.3 CatWalk Locomotor Measures
Digitally recorded paw prints were identified manually and the CatWalk system calculated time and location of the prints. However, the CatWalk software (version XT8.1.105.02) considered any break in paw contact as a separate step, including instances of dropped frames in the recording. Sequential paw prints that moved less than 7.5 mm in less than 0.3 seconds were considered “double-taps” of the same step and merged together with custom software (MATLAB, Mathworks Inc, Natick, MA). Following the C4/5 right overhemisection injury, rats did not travel in straight continuous paths from one end to the other, but staggered about with starts and stops. The CatWalk software assumes that animals walk in straight lines parallel to the coordinate frame set by the computer, and base kinematic measures off of this coordinate frame. Instead, we developed custom algorithms to rotate the coordinate frame and base the kinematic measures off of the walking animal’s coordinate frame. The angle of rotation was defined as the mean trajectory of the preceding steps of the animal’s four limbs (Figure 1). These custom algorithms enabled us to accurately quantify multiple measures for each limb of rats that did not walk in straight continuous paths.
Figure 1. Rotation of CatWalk Coordinates.
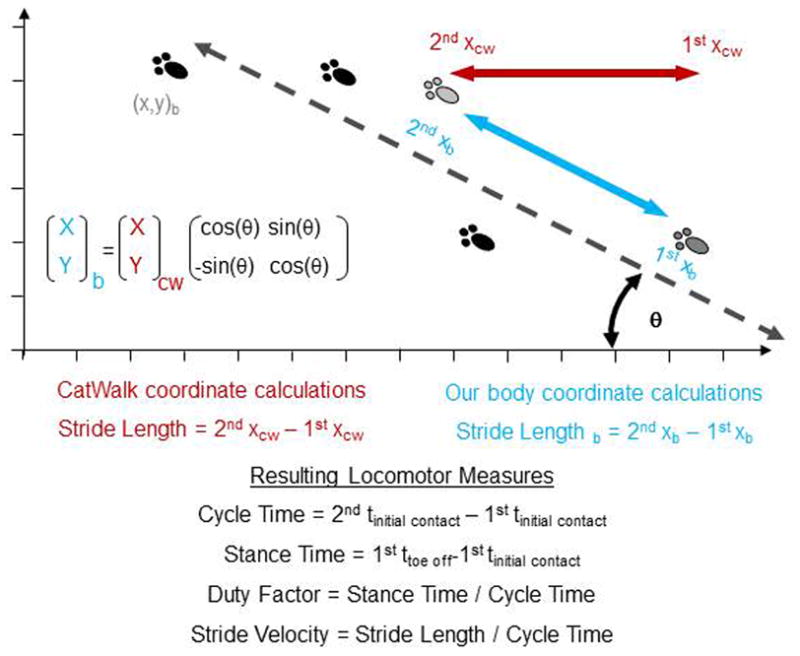
To correct for rats not traveling in straight lines parallel to the edge of the glass walkway, custom software was used to rotate the CatWalk coordinate frame to a body coordinate frame of the walking rat. This new body coordinate frame was then used to calculate the locomotor measures.
For this study, many of the kinematic measures are quantified for the movements of each individual limb, not the movement of the whole animal. This enables us to accurately track the asymmetric changes following injury. Thus stride length is measured as the distance along the path of travel between consecutive placements of the same paw (2nd x position – 1st x position); cycle time is the time between consecutive placements of the same paw (time of 2nd initial contact – time of 1st initial contact); and stride velocity is the quotient of stride length and cycle time (Figure 1). However, because all limbs contribute to the propulsion of the animal, the rat’s overground velocity at any point during the trail was calculated as the average of the stride velocities of all limbs at that time point.
Footfall patterns were analyzed in order to track the changes in interlimb coordination. Our custom software identified the same 6 patterns as the CatWalk software; Cruciate a (RF-LF-RH-LH) & b (LF-RF-LH-RH), Alternate a (RF-RH-LF-LH) & b (LF-RH-RF-LH), and Rotate a (RF-LF-LH-RH) &b (LF-RF-RH-LH), however we introduced a bias towards the less common rotate patterns. For example, the left forelimb in the step sequence RH-RF-LH-LF-RF-RH-LH could be the last step in an Ab pattern or the first step of an Rb pattern. Our software classified it as part of the Rb pattern. Uncoordinated stepping patterns were observed both pre and to a greater extent post-injury. However, batch processing of the CatWalk data with our custom software was unable to distinguish between uncoordinated patterns and incompletely recorded coordinated stepping patterns. Therefore uncoordinated steps were excluded from analysis.
2.4 Conventional Mean Analysis
Although the animals tested here were not motivated or constrained to perform the walking task at a certain velocity, conventional analysis of means was conducted to serve as a comparison to the regression analysis techniques. Each rat’s locomotor measures collected during the trial were reduced to a single mean value. These collections of mean values from each group were then compared via a single factor ANOVA, with a p<.05 considered significant.
Additionally, mean analysis was performed on a sub-set of steps that were restricted in accordance with established practices. To ensure that only walking and not slower “exploring” steps were analyzed, only steps from trials completed in fewer than 8 seconds (or faster than 16.25 cm/s) were analyzed (Hamers et al., 2001). To accurately compare locomotion between groups, only steps from trials completed within the same 1 second window were compared (Bozkurt et al., 2011–Deumens et al., 2007). The standard window is for trails completed between 1 and 2 seconds, or walking velocities of 130–65 cm/s. This particular velocity range was much faster than many of our recorded steps, so 3 different 1 second windows were analyzed; slow (7.5–6.5 seconds or 17.33–20 cm/s), medium (5.5–4.5 seconds or 23.63–28.89 cm/s), and fast (3.5–2.5 seconds or 37.14 – 52 cm/s). These windows were chosen because they maximized the number of recorded steps found within each window while also maintaining a 1 second gap between windows. Again, these collections of mean values from each group were then compared via a single factor ANOVA, with a p<.05 considered significant.
For the analysis of the mean values found with different coordination patterns a one-way ANOVA test was performed with a p<.05 considered significant. Due to the low N of these coordination pattern data sets, a paired t-test was used for post-hoc analysis with a p<.05 considered significant. The pairs were the mean values from the same limb of the same rat under different coordination patterns.
2.5 Nonlinear Regression Analysis
The velocity dependence of rodent locomotor measures has garnered little attention in the neuroscience literature, and even less attention has been paid to the choice of regression models. Linear models are the most easily understood, with comparisons of slope, intercept, and coefficient of determination (aka R2), commonplace. But simple linear models are not necessarily the best fit to the data. And while nonlinear models with multiple degrees of freedom may achieve very good fits, they are at risk of losing physiological meaning. Therefore the importance of choosing the proper regression model should not be overlooked; a balance needs to be struck between a good fit and maintaining physiological relevance. In regards to rodent locomotion, a little knowledge of the physical limitations will provide excellent guidance. In order to move at a stride velocity of 0 mm/s a rodent can either take a stride length of 0 mm or an infinitely long cycle time. Therefore any models of the velocity dependence of stride length, or the inverse of cycle time, should be constrained to pass through the origin. An idea first proposed by Clarke 79. Likewise, as velocity is increased, stride length and the inverse of cycle time should continually increase. With this in mind, any number of exponential growth models would be appropriate. We chose power functions for their simplicity, low degrees of freedom, goodness of fit upon visual inspection with pre-injury data, and their previous use in locomotion literature (Hruska et al., 1979,Halbertsma, 1983–Górska et al., 1999). Specifically for this study we chose to represent stride length = β1*velocityβ2, and cycle time = 1/(β1*velocityβ2) with β1 and β2 constrained to positive values.
The stance/swing phasing of the steps was represented as a percentage of the total step cycle that was in stance phase (calculated as stance time / cycle time) and is referred to as duty factor. Being a percentage, this measure is limited to values between 0 and 1, and the nonlinear model needs to reflect this physiological constraint. We chose to represent duty factor with an exponential decay model for its low degrees of freedom and goodness of fit upon visual inspection with pre-injury data. Specifically for this study we chose to represent duty factor = β1*e (−β2* velocity) with β1 constrained to values between 0 and 1 and β2 constrained to positive values to ensure decay.
The three dependent variables of stride length, cycle time, and duty factor are not regressed against the stride velocity, for that would lead to an improperly determined system (i.e. comparing x to x/t). Instead the variables are regressed against the overground velocity of the animal, as it is our intention to examine how each limb contributes to the overall motion of the animal. All regression lines were found via the MATLAB lsqcurvefit function with default settings except for a maximum of 5,000 iterations, and a function and X tolerance of 1*10−9.
Because there were no restrictions placed upon the animals while completing the walking task, the total number of steps recorded varied from animal to animal. Therefore the regression models were not applied to all the recorded steps but to a randomly (via the MATLAB permutation function) selected subset that included the largest equal number of steps from every rat. This prevented the data from being skewed towards the animals that took more steps. For example, at least 3 left hindlimb steps were successfully recorded from each of the 46 rats pre-injury. Therefore the regression analysis was not applied to all steps recorded but to the subset of 3 randomly selected steps from each of the 46 rats, for a total of 138 data points.
2.6 Comparing Regressions
Our focus was not so much on the regression models and their respective fits, but how these models changed following neurological injury. To compare any two of the previously described regression lines the below F statistic was used (Motulsky and Christopoulos, 2004).
Simply put, this equation states that if the data from the two groups has significantly less error when expressed as two separate lines than it does as one combined line, than the groups are in fact different. This statistic has previously been used to compare mouse locomotion across a range of velocities, but not pre/post-injury (Herbin et al., 2004–Herbin et al., 2007).
However, because the regression lines were based off a random sampling of all steps recorded, the analysis was repeated 10,000 times and only results that were significantly different (p<.05) more than 95% of the time were considered significant. This technique also allowed for groups of different sizes to be compared (pre-injury N=46, one week post N=35, weekly measures starting on post-injury day 11 N=9).
3. Results
3.1 Significant Locomotor Deficits 1 Week after Injury
One week after a C4/5 right overhemisection injury rats exhibit drastic locomotor impairments. The mean overground velocity as well as the mean stride length of all four limbs is significantly less than the pre-injury values (see table 1, and S1). The mean cycle times of all four limbs are greater than pre-injury values, although not statistically significant for the forelimbs (left p=0.175, right p=0.054). The mean duty factor increased in both hindlimbs (not significantly in the right, p=0.152), but significantly decreased in the right forelimb while significantly increasing in the left. These results are consistent with previous C4/5 right overhemisection injuries performed by our laboratory (Bregman et al., 1993–Lynskey et al., 2006,Dai et al., 2009–Dai et al., 2011).
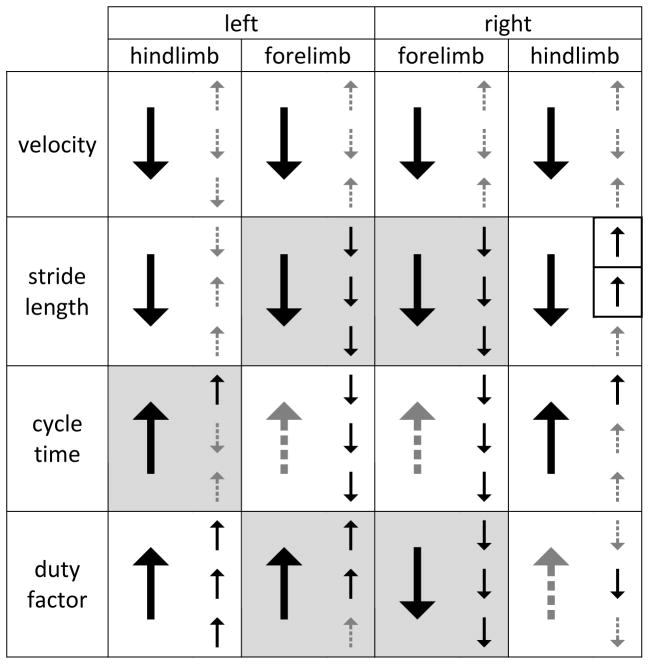
Table 1. Changes in Locomotor Measures 1 Week After Injury.
Significant increases (↑)/decreases (↓) in solid black, insignificant in dashed gray. Large arrows represent overall mean, small arrows represent slow (top), medium (middle), and fast (bottom) constrained velocities (p<.05, all N >=6). Discrepancies between overall mean and constrained mean noted with black border. Significant differences found via nonlinear regression analysis represented with shading.
|
3.2 Different Deficits Found at Different Velocities
Instead of comparing all steps collected, only steps that fell into similar velocity windows were compared. For some measures these constrained means were no different than the overall mean. For instance, the right forelimb duty factor significantly decreased at the slow, medium, and fast speeds, just as the overall mean significantly decreased (table 1, S1). However, there were several instances where the constrained mean differed from the overall mean. The overall mean cycle time increased in the left hindlimb one week after injury. This increase was still observed when only slow steps were compared, but no significant differences were found at the medium or fast speeds (fig 2). A stark contrast between choice of means can be seen in the stride length of the right hindlimb where the overall mean significantly decreased following injury but the slow and medium constrained means significantly increased (fig 3).
Figure 2. Left Hindlimb Cycle Time Across All Velocities Changes Following Injury.

The cycle time of every left hindlimb step is plotted against the overground velocity at which it was taken for both pre (green squares) and 1 weeks post-injury (red circles). These values were reduced to overall means (large bars on top and right side) which were significantly different (pre N=46, post N=35, p<.001). The mean cycle time was also analyzed within constricted velocities; slow (pre N=18, post N=13, p=.014), medium (pre N=32, post N=15), and fast (pre N=26, post N=9). F test analysis found significant differences between pre and post-injury cycle time regression lines in 9,790 of the 10,000 analysis iterations, or 97.9%, thus the cycle time across all velocities was deemed significantly different following injury. For the representative regression lines presented here the 3 randomly selected steps from 46 pre-injury rats (solid squares) produced a line (r2=0.898) that was significantly different (p<.001) from the line (r2=0.726) that was produced from the 1 randomly selected step from 35 post-injury rats (solid circles).
Figure 3. Right Hindlimb Stride Length Across All Velocities Does Not Change Following Injury.

The stride length of every right hindlimb step is plotted against the overground velocity at which it was taken for both pre (green squares) and 1 weeks post-injury (red circles). These values were reduced to overall means (large bars on top and right side) which were significantly different (pre N=46, post N=33, velocity p<.001, stride length p=.005). The mean stride length was also analyzed within constricted velocities; slow (pre N=19, post N=9, p=.007), medium (pre N=34, post N=14, p=.02), and fast (pre N=26, post N=9). F test analysis found significant differences between pre and post-injury stride length regression lines in only 8,671 of the 10,000 analysis iterations, or 86.71%, thus the stride length across all velocities was deemed to be no different following injury. For the representative regressions presented here the 3 randomly selected steps from 46 pre-injury rats (solid squares) produced a line (r2=0.664) that was no different (p=.687) from the line (r2=0.556) that was produced from the 1 randomly selected step from 33 post-injury rats (solid circles).
3.3 Significant Locomotor Deficits Across All Velocities
In lieu of analyzing means which differ at different velocities, we analyzed the change in regression lines of the stride length, cycle time, and duty factor as a function of overground velocity. We found that the forelimbs exhibited significantly different stride lengths and duty factors across all velocities one week following a right C4/5 overhemisection injury. A significant change in the left hindlimb cycle time was observed, but no other hindlimb differences were found. The differences between classical mean analysis and regression analysis can be seen more clearly in figures 2 and 3.
The change in left hindlimb cycle time 1 week following injury can be seen in figure 2. The significant decrease in overall mean overground velocity from 297.0 ±93.9 to 177.4 ±115.1 mm/s is represented by the bars at the top of the graph and the significant increase in overall mean cycle time from 0.402 ±0.086 to 0.704 ±0.337 sec is represented by the bars at the right of the graph. The constrained mean velocities are also represented by bars at the top of the graph and the corresponding constrained mean cycle times are on the right with a significant increase from 0.483±0.051 to 0.576 ±0.138 sec for the slow velocity but no significant differences in the medium or fast velocities. A representative regression line for a random sampling of steps is plotted for both pre and post-injury. 97.9% of the random samplings analyzed produced significantly different regression lines, thus the cycle time of the left hindlimb across all velocities was deemed significantly different following injury.
The change in right hindlimb stride length 1 week following injury can be seen in figure 3. The significant decrease in overall mean overground velocity from 295.9 ±94.4 to 179.4 ±131.5 mm/s is represented by the bars at the top of the graph and the significant decrease in overall mean stride length from 107.6 ±16.8 to 94.8 ±22.7 mm is represented by the bars at the right of the graph. The constrained mean velocities are also represented by bars at the top of the graph and the corresponding constrained mean stride lengths are on the right with a significant increase from 93.8±12.7 to 113.0 ±22.2 mm for the slow velocity, a significant increase from 104.6±11.2 to 114.5 ±16.9 mm for the medium velocity, but no significant difference at the fast velocities. A representative regression line for a random sampling of steps is plotted for both pre and post-injury. 86.7% of the random samplings analyzed produced significantly different regression lines, thus the stride length of the right hindlimb across all velocities remained unchanged following injury. Therefore the change in mean stride length arose from the reduction in mean velocity, and not a change in stride length behavior across all velocities.
3.4 Locomotor Changes Independent of Coordination Pattern
Rats employ several distinct coordination patterns while walking which our custom software was able to parse out into the same 6 categories as the CatWalk software. The preceding locomotor measures were analyzed to see if there was a coordination pattern dependence in addition to the velocity dependence. All 46 rats employed the common alternate Ab pattern at some point during the pre-injury trials, 20 rats (43%) took steps with a cruciate Cb pattern, 15 (33%) Ca, 7 (15%) Aa, 1 (2%) rotate Ra, and 1 (2%) Rb. 1 week following injury the Ab pattern was still the most common, but not used by all rats; 17 of the 35 rats (49%). The Cb pattern was also used less following injury (7 rats, 20%). The other coordination patterns were used more frequently following injury; Ca (16 rats, 46%), Rb (15 rats, 43%), Aa (9 rats, 26%), and Ra (6 rats, 17%). The mean values of overground velocity, stride length, cycle time, and duty factor for each coordination pattern were compared, and there were no significant differences across all limbs for either pre or post-injury. The mean values of stride length, cycle time, and duty factor for each coordination pattern were compared at each of the constrained velocity windows, and again there were no significant differences across all limbs for either pre or post-injury at the slow medium or fast velocities. When the stride length, cycle time, and duty factor regression lines for each coordination pattern were compared, there were no significant differences between the preferred Ab pattern and any of the other 5 coordination patterns. This was true pre and 1 week post-injury (fig 4). Therefore steps taken under any and all coordination patterns were pooled together throughout the study presented here.
Figure 4. No Difference in Limb Measures Across All Velocities Under Different Coordination Patterns.

Regression analysis, as well as overall, and constrained mean analysis, found no significant differences between measures recorded under the most popular Ab footfall pattern and any other pattern, pre or 1 week post-injury. For the left hindlimb cycle time presented here all steps from known coordination patterns are plotted (hollow markers) and a randomly selected sub set of steps (solid markers) are used to create the representative regressions lines. An insufficient number of rats (<5) produced pre-injury Ra or Rb patterns, so no regression lines were produced.
3.5 Spontaneous Recovery of Right Forelimb
While the regression lines are calculated for the individual limbs, they are still used to interpret the locomotor behavior of the entire animal. Upon visual inspection, the pre-injury duty factor regression lines are similar for all 4 limbs, with a very strong right-left symmetry (green lines of Fig 5). 1 week following injury the forelimb regression lines are significantly different from their pre-injury levels, but also exhibit a right-left asymmetry, with the left forelimb regression line shifting up and the right line shifting down (red lines of fig 5). This relates to the left forelimb spending more time in stance phase and the right forelimb spending less, for any walking speed. A subset of 9 animals were tested weekly, and over a period of 7 weeks, the left forelimb duty factor continued to be significantly shifted up from pre-injury levels. In contrast, 6 weeks after injury the right forelimb duty factor was no longer different from pre-injury levels. Visual inspection of figure 5 shows the weekly left forelimb regression lines maintaining a similarity with the 1 week post-injury line, whereas the weekly right forelimb lines shift up towards the pre-injury levels. This change of a locomotor function from a significantly different post-injury level to a level no different than pre-injury, was spontaneous.
Figure 5. Spontaneous Recovery of Right Forelimb Duty Factor.

The duty factor regression lines for all four limbs for seven consecutive weeks following injury shows minimal change to the behavior of the hindlimbs but significant asymmetric change to the forelimbs. Over time the right forelimb regression lines approach pre-injury levels (no significant difference from pre-injury at week 6) whereas the left forelimb lines maintain post-injury behaviors.
From figure 5 it can be seen that the pre and 1 week post-injury regression lines extend across a wider range of velocities than the regression lines from the subset of 9 animals that were tested weekly. This should not be interpreted as a permanent decrease or change in range of the overground velocities of the 9 weekly measured animals. The larger velocity range in the pre and 1 week post-injury regression lines comes from the other rats that were not included in the weekly subset. This was confirmed by comparing the overground velocities of each of the 9 rats in the subset. Prior to injury the subset of 9 rats traveled at 217.14±66.57 mm/sec. This was significantly reduced to 89.36±28.27 mm/sec 1 week following injury (p<0.001 one way ANOVA), but returned to a pre-injury level of 168.45±32.15 mm/sec 5 weeks post-injury (p=0.063). Likewise the range of velocities traveled by the subset of 9 animals was significantly reduced from 137.39±58.7 mm/sec to 60.19±30.28 mm/sec 1 week following injury (p=0.01), but returned to a pre-injury level of 96.04±61.6 mm/sec 2 weeks post-injury (p=0.181). And to further characterize the distribution of velocities of the 9 animals in the weekly measured subset, it was found that the minimum pre-injury velocities were not significantly greater than the maximum post-injury velocities for any and all weeks tested, indicating at least partial overlap.
3.6 Compensatory Techniques Develop in Hindlimbs
As with the duty factor, upon visual inspection, the pre-injury stride length regression lines are similar for all 4 limbs, with a very strong right-left symmetry (green lines of Fig 6). 1 week following injury the forelimb stride length regression lines are significantly different from their pre-injury levels, but do not exhibit a right-left asymmetry, with both regression line shifting down (red lines of fig 6). This relates to the forelimbs taking shorter strides following injury, for any walking speed. The forelimb stride lengths return to pre-injury levels 2 weeks following injury. The hindlimb stride lengths remain unchanged 1 week following injury, and again 2 weeks after injury. However, starting from the 3rd week post injury through the course of the study the hindlimb stride lengths are significantly different (except for the right hindlimb at the 5 week mark). This significantly different locomotor behavior was not initially present after injury, but developed spontaneously 3 weeks later.
Figure 6. Compensatory Techniques Found in Hindlimb Stride Length.

The stride length regression lines for all four limbs for seven consecutive weeks following injury shows a quick recovery, with all four limbs no different than pre-injury levels by week 2. However, by 3 weeks post-injury the hindlimbs develop behaviors that are significantly different from pre-injury, and are maintained 7 weeks post-injury.
3.7. Limited Changes in Cycle Time over Time
Again, upon visual inspection, the pre-injury cycle time regression lines are similar for all 4 limbs (green lines of Fig 7). 1 week following injury the forelimb cycle time regression lines are not significantly different from their pre-injury levels, and this behavior is maintained for 7 weeks (except in post-injury week 3). The left hindlimb cycle time is significantly different for all 7 post-injury weeks. And except for post-injury week 1, the right hindlimb is also significantly different for the 7 weeks post-injury. The upward shifting of the hindlimb regression lines represents an increase in cycle time across all velocities.
Figure 7. Limited Changes in Cycle Time over Time.

The cycle time regression lines for all four limbs for seven consecutive weeks following injury shows a contrast between the forelimbs and hindlimbs. Both forelimbs exhibit little difference from pre-injury values over the 7 weeks, while the hindlimbs show significant differences from pre-injury for the entire 7 weeks (except for 1 weeks post-injury on the right hindlimb).
4. Discussion
Spinal cord injury results in functional deficits that are commonly assessed with changes in locomotor measures. However, many of these locomotor measures are velocity dependent, making it difficult to compare accurately fast moving healthy animals to slower walking injured animals. Comparing mean locomotor measures obtained at similar velocities is a viable technique to circumvent the issue of velocity dependence. But as we have shown here, the choice of which velocity to compare at is important, as different locomotor changes were found at different velocities. Additionally, only a small percentage of the animals total locomotor performance lies within these constrained velocity windows. Therefore in order to more accurately compare the velocity dependent behaviors of faster walking pre-injury rats to slower walking post-injury rats under any coordination pattern we employed a regression analysis technique. This allowed us to parse out which changes were due to changes in animal behavior and not just a result of a reduction in walking speed. Specifically, 1 week following injury the mean stride length of the right hindlimb significantly decreased. But via the regression technique we found that there were no significant differences between pre and post-injury. The animals were merely performing at different points along similar lines.
While all limbs contribute to the motion of the animal, they do not necessarily contribute equally, especially following an asymmetric injury such as the right C4/5 overhemisection performed here. We therefore measured the step parameters of stride length, cycle time, and duty factor individually for each limb. This allowed us to get a better sense of how each limb was contributing to the overall motion of the animal. One week post-injury it was found that the forelimbs had significant changes in stride length and duty factor while only the left hindlimb significantly changed its cycle time. It may be counterintuitive to envision different limbs of the same animal changing their locomotor measures is such different ways, but the only physical link between the different limbs is that they travel at similar speeds to the body of the animal to which they are all attached to. If the forelimbs decrease their stride length without changing their cycle time, then the hindlimbs can increase their cycle time without changing their stride length, and maintain the same overground velocity. With the regression analysis this same phenomenon is expressed as a shifting down of the forelimb stride length lines, and a shifting up of the hind limb cycle time lines.
In the weeks following injury, the forelimb stride length regression lines quickly return to pre-injury levels, but the hindlimb cycle time regression lines do not. Behaviorally this means that the forelimbs recover and begin to take longer strides while the hindlimbs do not recover and continue to take slow steps. This would imply that the limbs are working against each other as the forelimbs would generate a velocity that is faster than the hindlimb velocity. However, as the weeks progress the animals correct for this imbalance by learning to increase their hindlimb stride length, thus matching the velocity generated by the forelimbs. We feel that this is evidence of a compensatory technique. The hindlimb stride length, which was at pre-injury levels 1 week following injury, changes significantly to compensate for the lack of change in the hindlimb cycle time. This has considerable implications for rehabilitation research, as treatment groups should not be compared to the initial post-injury measures, but to the moving target that is spontaneous recovery with compensatory techniques.
The C4/5 right overhemisection injury profoundly disrupts the cortical projections to the right forelimb, and upon visual inspection it is the most affected limb. That is why it is somewhat surprising that there are so few locomotor changes, and a quick recovery of such an impaired limb. But, if we think of the locomotor changes presented here not as the results of physical limitations following injury, but as the outcome of a new preferred locomotion technique, the performance of the right forelimb is not as surprising. The right forelimb is profoundly impaired; the other limbs are not. The other limbs, with a greater range of motion and more cortical control, have a better ability to vary their locomotion. And they use this variability to compensate for the impaired right forelimb. The less impaired limbs produce significantly different locomotion following injury not because they are incapable of taking pre-injury steps, but because it is what is needed in order for the severely impaired right forelimb to adequately participate in locomotion. This is one possible explanation for why the left forelimb duty factor maintains significantly different post-injury behavior, but the right forelimb does modify its behavior towards pre-injury levels.
5. Conclusions
Following a C4/C5 right overhemisection spinal cord injury rats have significantly different forelimb stride lengths and duty factors, but only show significant differences in the left hindlimb cycle time. These differences are not in mean measures, but in velocity dependent regressions, which allow for the comparison of locomotor behaviors at any overground walking speed. Over time these post-injury behaviors change, with the right forelimb spontaneously recovering while the hindlimbs show evidence of developing compensatory techniques.
Supplementary Material
Highlights.
Following cervical spinal cord injury significant differences found in forelimb stride lengths and duty factors, and left hindlimb cycle time.
Regression analysis technique employed to compare faster pre-injury locomotion with slower post-injury locomotion more accurately
Post-injury behaviors change over time; right forelimb spontaneously recovers, hindlimbs develop compensatory techniques.
Acknowledgments
This work was support by grants from NIH / NICHD (1K99HD067339-01 to ND Neckel, R24HD050845-05 to BS Bregman, T32HD007459 to BS Bregman), NIH/NINDS (R01NS051656 to BS Bregman), and NIDRR (H133P100015 to BS Bregman).
Footnotes
Publisher's Disclaimer: This is a PDF file of an unedited manuscript that has been accepted for publication. As a service to our customers we are providing this early version of the manuscript. The manuscript will undergo copyediting, typesetting, and review of the resulting proof before it is published in its final citable form. Please note that during the production process errors may be discovered which could affect the content, and all legal disclaimers that apply to the journal pertain.
Contributor Information
Haining Dai, Email: daih@georgetown.edu.
Barbara S. Bregman, Email: bregmanb@georgetown.edu.
References
- 1.Hamers FP, Koopmans GC, Joosten EA. CatWalk-assisted gait analysis in the assessment of spinal cord injury. J Neurotrauma. 2006;23(3–4):537–48. doi: 10.1089/neu.2006.23.537. [DOI] [PubMed] [Google Scholar]
- 2.Zörner B, Filli L, Starkey ML, Gonzenbach R, Kasper H, Röthlisberger M, Bolliger M, Schwab ME. Profiling locomotor recovery: comprehensive quantification of impairments after CNS damage in rodents. Nat Methods. 2010;7(9):701–8. doi: 10.1038/nmeth.1484. [DOI] [PubMed] [Google Scholar]
- 3.Hruska RE, Kennedy S, Silbergeld EK. Quantitative aspects of normal locomotion in rats. Life Sci. 1979;25(2):171–9. doi: 10.1016/0024-3205(79)90389-8. [DOI] [PubMed] [Google Scholar]
- 4.Hruska RE, Silbergeld EK. Abnormal locomotion in rats after bilateral intrastriatal injection of kainic acid. Life Sci. 1979 Jul 9;25(2):181–93. doi: 10.1016/0024-3205(79)90390-4. [DOI] [PubMed] [Google Scholar]
- 5.Clarke KA, Parker AJ. A quantitative study of normal locomotion in the rat. Physiol Behav. 1986;38(3):345–51. doi: 10.1016/0031-9384(86)90105-8. [DOI] [PubMed] [Google Scholar]
- 6.Koopmans GC, Deumens R, Brook G, Gerver J, Honig WM, Hamers FP, Joosten EA. Strain and locomotor speed affect over-ground locomotion in intact rats. Physiol Behav. 2007;92(5):993–1001. doi: 10.1016/j.physbeh.2007.07.018. [DOI] [PubMed] [Google Scholar]
- 7.Majczyński H, Maleszak K, Górska T, Sławińska U. Comparison of two methods for quantitative assessment of unrestrained locomotion in the rat. J Neurosci Methods. 2007;163(2):197–207. doi: 10.1016/j.jneumeth.2007.02.023. [DOI] [PubMed] [Google Scholar]
- 8.Heglund NC, Taylor CR, McMahon TA. Scaling stride frequency and gait to animal size: mice to horses. Science. 1974 Dec 20;186(4169):1112–3. doi: 10.1126/science.186.4169.1112. [DOI] [PubMed] [Google Scholar]
- 9.Taylor CR. Why change gaits? Recruitment of muscle and muscle fibers as a function of speed and gait. Amer Zool. 1978;18:153–161. [Google Scholar]
- 10.Hamers FP, Lankhorst AJ, van Laar TJ, Veldhuis WB, Gispen WH. Automated quantitative gait analysis during overground locomotion in the rat: its application to spinal cord contusion and transection injuries. J Neurotrauma. 2001;18(2):187–201. doi: 10.1089/08977150150502613. [DOI] [PubMed] [Google Scholar]
- 11.Tom VJ, Sandrow-Feinberg HR, Miller K, Santi L, Connors T, Lemay MA, Houlé JD. Combining peripheral nerve grafts and chondroitinase promotes functional axonal regeneration in the chronically injured spinal cord. J Neurosci. 2009;29(47):14881–90. doi: 10.1523/JNEUROSCI.3641-09.2009. [DOI] [PMC free article] [PubMed] [Google Scholar]
- 12.Hildebrand M. The quadrupedal gaits of vertebrates. Bioscience. 1989;39(11):766–775. [Google Scholar]
- 13.Muir GD, Webb AA, Kanagal S, Taylor L. Dorsolateral cervical spinal injury differentially affects forelimb and hindlimb action in rats. Eur J Neurosci. 2007 Mar;25(5):1501–10. doi: 10.1111/j.1460-9568.2007.05411.x. [DOI] [PubMed] [Google Scholar]
- 14.Bozkurt A, Scheffel J, Brook GA, Joosten EA, Suschek CV, O’Dey DM, Pallua N, Deumens R. Aspects of static and dynamic motor function in peripheral nerve regeneration: SSI and CatWalk gait analysis. Behav Brain Res. 2011 May 16;219(1):55–62. doi: 10.1016/j.bbr.2010.12.018. [DOI] [PubMed] [Google Scholar]
- 15.Deumens R, Jaken RJ, Marcus MA, Joosten EA. The CatWalk gait analysis in assessment of both dynamic and static gait changes after adult rat sciatic nerve resection. J Neurosci Methods. 2007 Aug 15;164(1):120–30. doi: 10.1016/j.jneumeth.2007.04.009. [DOI] [PubMed] [Google Scholar]
- 16.Bregman BS, Kunkel-Bagden E, Reier PJ, Dai HN, McAtee M, Gao D. Recovery of function after spinal cord injury: mechanisms underlying transplant-mediated recovery of function differ after spinal cord injury in newborn and adult rats. Exp Neurol. 1993;123(1):3–16. doi: 10.1006/exnr.1993.1136. [DOI] [PubMed] [Google Scholar]
- 17.Lynskey JV, Sandhu FA, Dai HN, McAtee M, Slotkin JR, MacArthur L, Bregman BS. Delayed intervention with transplants and neurotrophic factors supports recovery of forelimb function after cervical spinal cord injury in adult rats. J Neurotrauma. 2006;23(5):617–34. doi: 10.1089/neu.2006.23.617. [DOI] [PubMed] [Google Scholar]
- 18.Halbertsma JM. The stride cycle of the cat: the modelling of locomotion by computerized analysis of automatic recordings. Acta Physiol Scand Suppl. 1983;521:1–75. [PubMed] [Google Scholar]
- 19.Górska T, Zmysłowski W, Majczyński H. Overground locomotion in intact rats: interlimb coordination, support patterns and support phases duration. Acta Neurobiol Exp (Wars) 1999;59(2):131–44. doi: 10.55782/ane-1999-1304. [DOI] [PubMed] [Google Scholar]
- 20.Motulsky HJ, Christopoulos A. Fitting models to biological data using linear and nonlinear regression. Oxford University Press; NY, USA: 2004. [Google Scholar]
- 21.Herbin M, Gasc JP, Renous S. Symmetrical and asymmetrical gaits in the mouse: patterns to increase velocity. J Comp Physiol A Neuroethol Sens Neural Behav Physiol. 2004 Nov;190(11):895–906. doi: 10.1007/s00359-004-0545-0. [DOI] [PubMed] [Google Scholar]
- 22.Herbin M, Hackert R, Gasc JP, Renous S. Gait parameters of treadmill versus overground locomotion in mouse. Behav Brain Res. 2007 Aug 6;181(2):173–9. doi: 10.1016/j.bbr.2007.04.001. [DOI] [PubMed] [Google Scholar]
- 23.Dai H, MacArthur L, McAtee M, Hockenbury N, Tidwell JL, McHugh B, Mansfield K, Finn T, Hamers FP, Bregman BS. Activity-based therapies to promote forelimb use after a cervical spinal cord injury. J Neurotrauma. 2009;26(10):1719–32. doi: 10.1089/neu.2008-0592. [DOI] [PMC free article] [PubMed] [Google Scholar]
- 24.Dai H, Macarthur L, McAtee M, Hockenbury N, Das P, Bregman BS. Delayed rehabilitation with task-specific therapies improves forelimb function after a cervical spinal cord injury. Restor Neurol Neurosci. 2011;29(2):91–103. doi: 10.3233/RNN-2011-0583. [DOI] [PubMed] [Google Scholar]
Associated Data
This section collects any data citations, data availability statements, or supplementary materials included in this article.