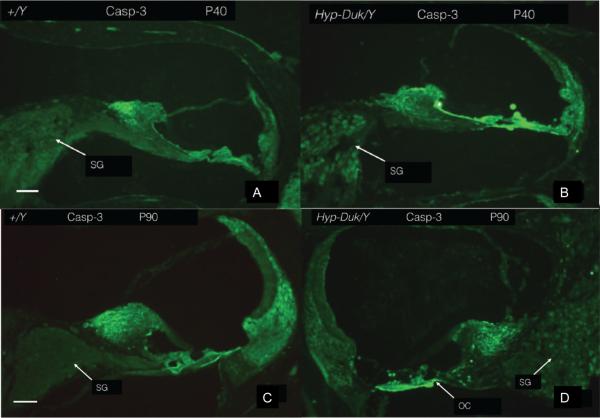
Figure 6.
(A, C) high-powered photomicrograph showing the absence of significant expression of activated caspase-3 in the control (+/Y) mouse at P40 and P90, respectively. (B, D) shows increased expression of activated caspase-3 in the SGNs of the mutant (PhexHyp-Duk/Y) mice at P40 and P90, respectively. SG; spiral ganglion. Scale bar (A to D) = 100 μm.

